Description:
This model is primarily used to identify stocks that are outperforming or underperforming the index.
Beta values indicate the correlation between two variables, such as a stock price and an index, over a “Period” of time.
Interpretation:
Buy signals are given when “Beta valuePlus” is greater than 1 and rising, and when the closing price of the relative object exceeds its “MV length” long average.
Sell signals are given when the “Beta valueMinus” is greater than one and when the closing price of the relative object is below its “MV length” long average.
Calculation:
If the beta value is 1, it is assumed that the price of the main object changes by the same percentage as the index.
If the beta value is, for example, 1.5, this means that a one percent change in the index’s price is assumed to lead to a change in the main object’s price of 1.5 percent.
In addition to the standard beta value, “Beta Value Plus” and “Beta Value Minus” are also calculated for the covariance with the relative object when it is rising and falling, respectively.
To give an idea of the object’s volatility, its standard deviation is also reported for the number of “Period” periods.
Settings:
MV length = the length of the price average.
Period = the number of periods on which the beta and volatility calculations are based.
Relative objects = selection of relative objects, e.g. an index.
Source: F1 in the Viking.
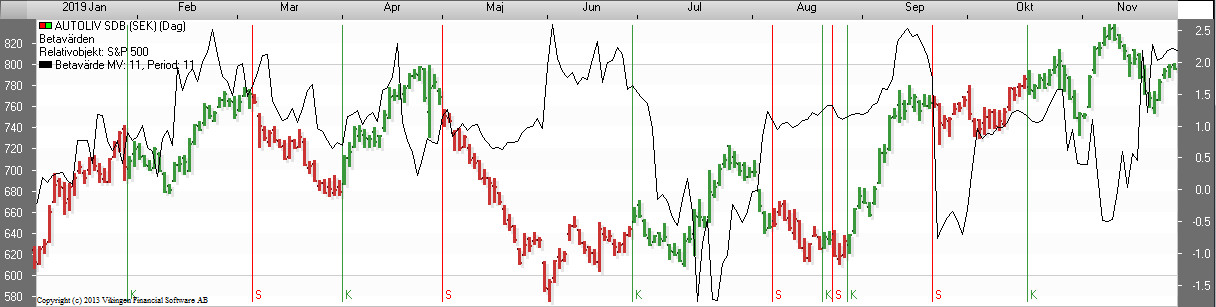
Beta values
Description
This model is primarily used to identify stocks that are strong or weak relative to the index.
Here, beta values are calculated, indicating the relationship between two objects, e.g.. a stock price and an index for a “Period” long period.
If the beta value is one (1.0), the price of the main object changes in the same percentage as the index. If the beta value is e.g. 1.5, this means that a (1.0) percent change in the price of the index is assumed to lead to a 1.5 percent change in the price of the main object.
Another example: If the Beta value = 2, then you can guess that the stock goes up 2% if the stock market goes up 1%.
When we talk about derivatives, the numbers are much bigger. For example, if a certificate has a beta value of 2000, the certificate goes up or down 20 times as much as the underlying object. This is called leverage 20.
Signals in the Viking
Buy if
- The beta value is greater than one AND
- The beta value is rising AND
- Index is above its average value
Sell if
- The beta value is less than -1 AND
- Index is below its average value
In addition to the standard beta value, “Beta Value Plus” and “Beta Value Minus” are also calculated for the covariance with the relative object when it is rising and falling, respectively.
Buy signals are given when “Beta valuePlus” is greater than one and rising, and when the closing price of the relative object exceeds its “MV length” long average.
Sell signals are given when the “Beta valueMinus” is greater than one and when the closing price of the relative object is below its “MV length” long average.
To give an idea of the object’s volatility, its standard deviation is also reported for the number of “Period” periods.
Good settings
Suggested values: An optimization on the most traded shares yielded:
| Average | Period | |
| Day | 34 | 12 |
| Week | 25 | 11 |
| Month | 17 | 10 |
How good is the model?
Here is a picture of the stock Hexpol which has yielded 6 times the money with monthly data (default setting 11.11), 15 years. Of course, there are shares that perform even better, such as 350 times the money. However, the model does not work well for all objects and there are much better models that fit more generally.
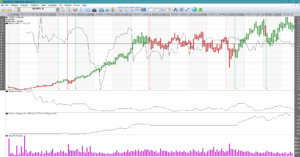
For those stocks that are relatively static, the model can work well. Otherwise, the model seems to be selling too late. If the stock behaves roughly like the index, there won’t be many signals. That is, the stock market can go down slowly, which means that the model does not sell if the stock moves like the stock market. A tip is to produce a summary table for the model and rank it by Beta value. This makes it easier to trust the signals for objects with high beta values. But then you might as well use the Volatility Signal model, which gives even better signals.
Settings:
MV length = the length of the price average.
Period = the number of periods on which the beta and volatility calculations are based.
Relative objects = selection of relative objects, e.g. an index.