Description:
Advance/Decline is simply a sum of the number of shares traded during a period and adding them up: those that have gone up, those that have gone down and those that have remained static. From these sums it is possible to construct an Advance/Decline line that gives a direction of where the market is heading as a whole. Data from the New York Stock Exchange is used for the calculation in general. It is of course possible to use data from any exchange, but only the NYSE provides such data (as far as I know today).
The problem with the A/D line is that it is easy to see divergences afterwards but extremely difficult to interpret it when the trader needs the information. At best, it can be used as a trend indicator.
Advance/Decline in Vikings
Description
In the Viking, the model called AdvanceDecline looks a bit different..
The Viking help file looks like this:
This model reports the following time series:
AdvanceDecline and a mean value, “MV length” long, on AdvanceDecline, “MV AdvanceDecline”. In addition, the “Total AdvanceDecline” is displayed which is a summation over the “Period” periods of the AdvanceDecline.
AdvanceDecline is given a value of one if the period’s closing price is higher than the previous period’s closing price and a value of minus one if the reverse is true.
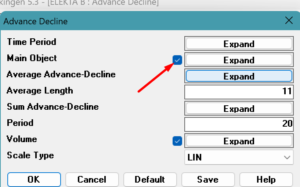
Settings:
MV length = the length of the mean value for AdvanceDecline.
Period = the number of periods over which AdvanceDecline is summed.
The Viking help file doesn’t make me any wiser so I called for help and got an answer from Björn:
This is how it works, I think:
Closing higher than previous: 1
Closing lower than previous: -1
Closure same as previous: 0
Sum these figures for the period. If the period is 14 days and each day had a higher close than the previous day, you get a value of 14 (a bit WAY overbought, perhaps…). If it has gone up as many days as it has gone down, the value is zero, etc.
These values provide an Advance/Decline line. It then becomes a bit choppy so you have to take an average value on the A/D line itself as well…
It is a kind of oscillator that tells you whether the stock is overbought or oversold.
Source: The friend (this Viking has asked to remain anonymous) in an email to the Viking group.
Advance means the stock is going up and Decline means it is going down. Promotion or demotion. In the Viking, only the price of the object itself is measured, not the number of shares in an index.
The Advance Decline model is a graphical description of when the price goes up or down compared to a previous period. It does NOT tell you when to buy or sell, but is a piece of the puzzle to understand the strength or rhythm of the stock. A common perception is the rule of 3. In an upward trend, it is said that the stock goes up for three days then goes down or stays put. But is it? Look at the pictures below:
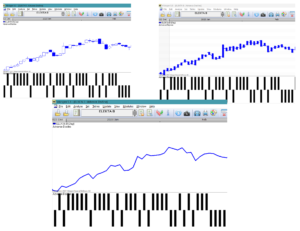
In the top chart on the left, it is presented as a Candle Stick chart. The empty squares show that the price has gone up on that day compared to the day before. It corresponds to a bar in the Advance section for each day.
Similarly when it goes down. Then the Candle Stick block is filled in and a stick appears in the Decline section below.
In Viking you can choose whether you want to see the price as a candle stick, line or bar chart. It is also possible to delete the course and show only the AD graph. In this case, right-click on the chart and check our main object.
Interpretation of Advance Decline
As you can see above, there are more Advance bars in an upward trend. You can quickly get a sense of whether the stock is generally going up or down. A bit like an RSI chart, the more bars at the top, the more likely the stock will soon lose momentum and go down or stand still. It will be overbought. Many bars in the Advance section mean that the stock is in a strong upward trend. If there are many bars in the Decline area, the stock is trending downwards.
Sum of Advance Decline
Total= The number of increases over a period minus the number of decreases over a period. ATTENTION! No average but a sum.
By creating a sum of the number of ups and downs, the sum is interpreted similarly to a Relative Strength Index (RSI).
When the sum of the number of rises minus falls is high, it indicates an overbought condition. When the total is low, it indicates an oversold situation. Overbought means that the price is likely to stop or fall soon. It may also mean that the rate of increase of the exchange rate is decreasing. It goes up more slowly.
On the contrary for an oversold location. When the amount is low, the price is likely to stay or go up. Or the rate of decline is slowing down.
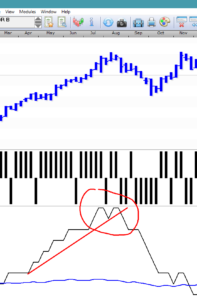
A very good interpretation, which also applies to RSI, is to look at formations. Double top, double bottom, trends, triangles, Head and shoulders. A double top at a high level indicates a very likely reversal in price.
Too short a period makes the signals too early and too long a period makes it slow. The sell signals come too late at too long a period to summarize. A value of 20 periods, day or week, is good. In the image below, it is a sum over 20 weeks. The double top indicates a reversal of the downward trend.