COPPOCK
Description:
The Coppock model was invented by Edwin Coppock. He designed the model to do only one thing; indicate when it was time to make long-term investments at the bottom of bear markets. The model was developed to work on the Dow Jones Index, but has proven to work well on all market indices.
The Coppock model generates a time series, which is calculated on the differences between the mean values of the closing prices.
The Coppock model shows the acceleration and deceleration of price developments. It also gives an indication of changes in the long-term trend.
Interpretation:
Coppock oscillates between positive and negative values. The long-term signal for investors to start buying comes when it swings up from a position below the 0 line. In other words, when it becomes less negative than it was before, i.e.. before it becomes positive
Coppock argued that his model was only for entering the market NOT for finding peaks to exit. For that he used other tools
Coppock does not give many signals, but they are relatively reliable when they come. The idea is to buy on signal and hold for the long term.
Shop at the top and bottom covers. Just at the highest or lowest point of the turn.
In the Viking version, we have been given buy and sell signals and the Coppock in the Viking is designed to signal at the turns.

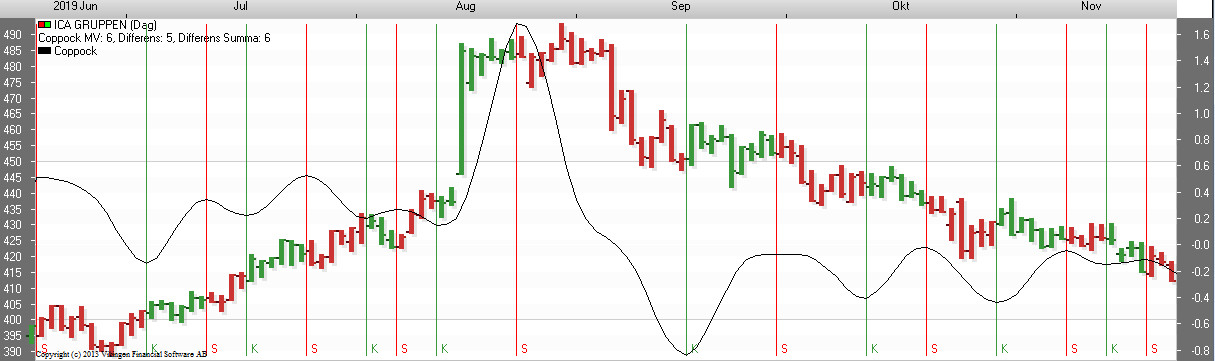
Buy signals are given when the Coppock curve passes a bottom and sell signals when it passes a top. I.e. when the Coppock curve is rising or falling.
The Coppock model is suitable for slightly longer investments.
Source: Greger
Coppoch models
Signal when the sum of mean differences turns up or down. Very good results are obtained when testing backwards and saving the best settings. The problem is that the historical settings in this model are not stable. They are good historically, but my experience tells me that those settings need to be adjusted over time.
As it is a model based on averages, it is a slow model and often gives a signal too late, but still decent. The advantage of averages is that they keep the number of transactions down and give people time to act.
Below is an example with Hennes & Mauritz that has returned 5500%, i.e. 55 times the money if you traded according to the model and monitored with weekly charts. Each bar is how the course has progressed over a week. Red indicates sell and green with K, indicates buy.
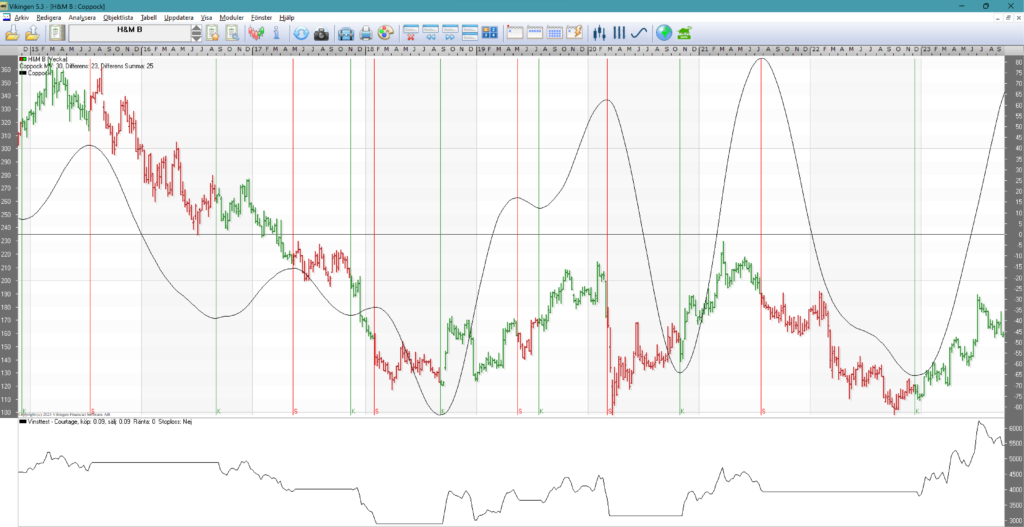
You can see in the picture that the model sometimes sells a little late, but still reasonably well.
When the price is stationary, the model changes direction frequently and there are too many signals. See below for a daily chart with Handelsbanken.
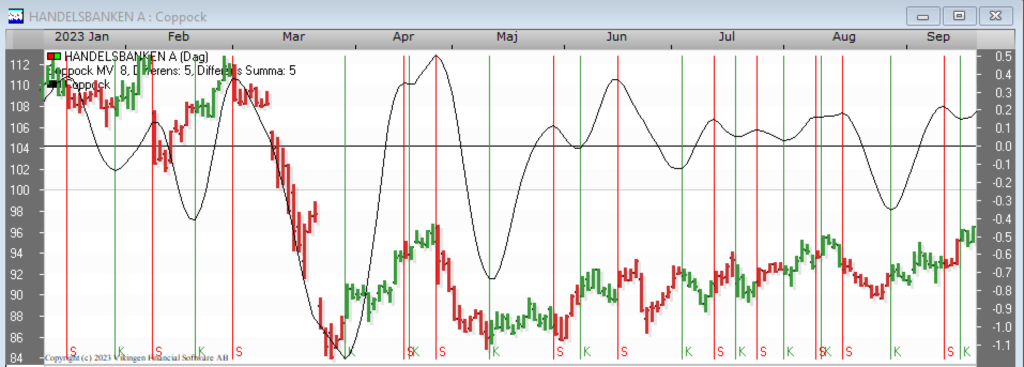
In times when prices are trending upwards and things are calm, the model works well. Then it is good to combine with other models that are faster like stochastics, volatility signal, multi-model, Peters specialists.
In general, the model seems to perform best with weekly data.
The Coppoch model in detail
The Coppock model shows the acceleration and deceleration of price developments. It also gives an indication of changes in the long-term trend.
The model is calculated as follows:
1) Calculate the moving average, A, with the length “MV length”.
2) Calculate the relative differences between mean, A, with the same mean, B, time-shifted “MV Difference” periods backwards in time.
3) Calculate the weighted sum over the “MV Difference Sum” pieces of these differences. Give the ‘oldest’ difference a weight of one and then gradually increase the weight by one.
Buy signals are given when the Coppock curve is rising.
Sell signals are given when the Coppock curve is falling.
Settings:
Mv length = the length of the price average.
MV Difference = number of periods on which the difference between the price averages is calculated.
MV Difference Total = number of differences summed up.
Good settings of the Coppoch model
With Vikingen Trading or Vikingen Maxi you can do back testing and test many combinations. The values below are the result of a test with 2.5 million combinations run on the 170 most traded shares in the Nordic region. Each share was saved with its own best optimized settings. On average, these settings were the best:
| Coppoch | |||
| Average value | Mean difference | Mean difference sum | |
| Day | 21 | 15 | 13 |
| Week | 21 | 15 | 11 |
| Month | 17 | 11 | 5 |