Description:
For those who want to study ATR. And have Viking Trading or Viking Option can create their own model as shown below.
The code is:
par(main: instrument;
AntPer: integer;
out ATR:realvector);
where
; FilledClose, FilledHigh, FilledLow : RealVector;
; R1, R2, R3, R4, TR : realvector;
begin
FilledClose := std.FILL(Main.Close);
FilledHigh := std.FILL(Main.High);
FilledLow := std.FILL(Main.Low);
// the difference between today’s High and Low
R1 := FilledHigh – FilledLow;
// the difference between today’s Low and yesterday’s Close
R2 := std.Abs(FilledLow – Shift(FilledClose, 1));
// the difference between today’s high and yesterday’s close
R3 := std.Abs(FilledHigh – Shift(FilledClose, 1));
// The largest difference is stored in TR (True Range)
R4 := std.Alt((R1 > R2), R1, R2);
// The largest difference is stored in TR (True Range)
TR := std.Alt((R3 > R4), R3, R4);
// Calculate exponential moving average (MV). AntPer = number of periods
ATR := std.Mavx(TR, AntPer);
end;
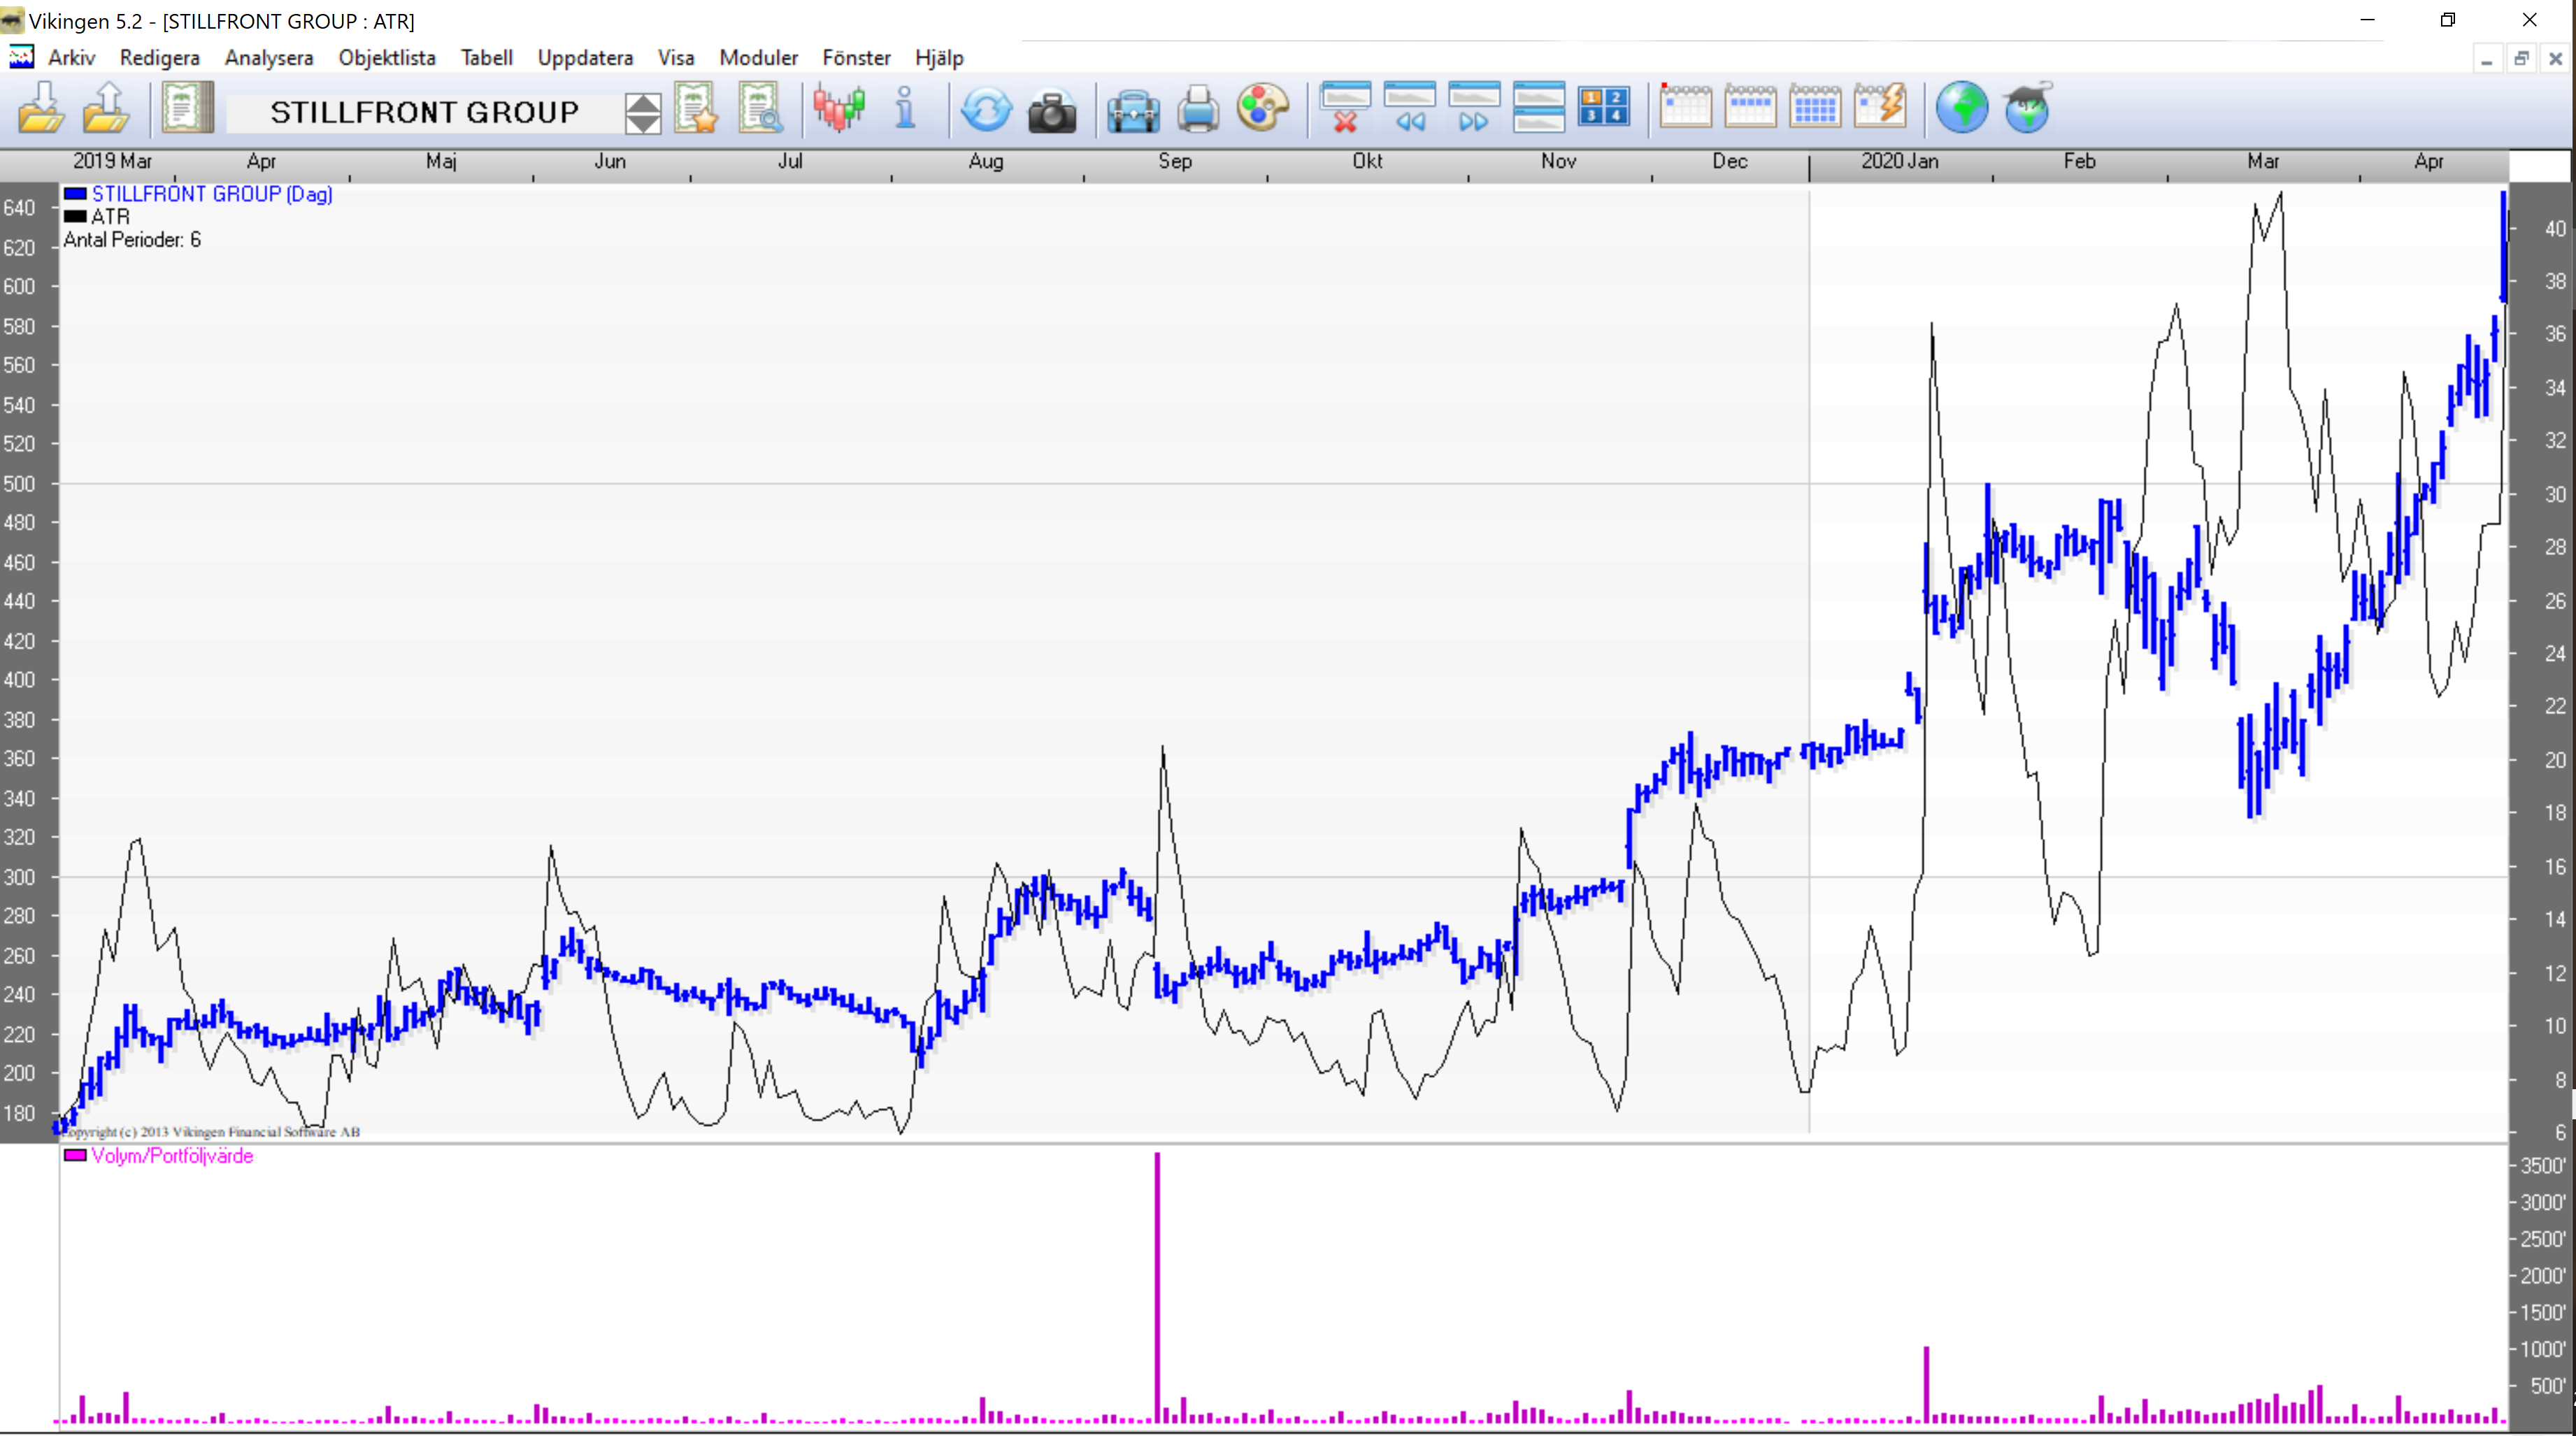
The presentation could look like this if the price bar is placed on the left and the ATR on the right.