 Here 3 models are shown independently of each other. There are not 3 combined models, but they are shown separately.
Summary
1. look first and foremost at the Bollinger bands at the top. Is it a current or recent signal? If yes -> proceed to points 2 and 3.
2. Does RSI have a formation at the moment? Buy or sell formation?
3. Do all 3 Momentum curves point in the same direction as the signal from the Bollinger Band?
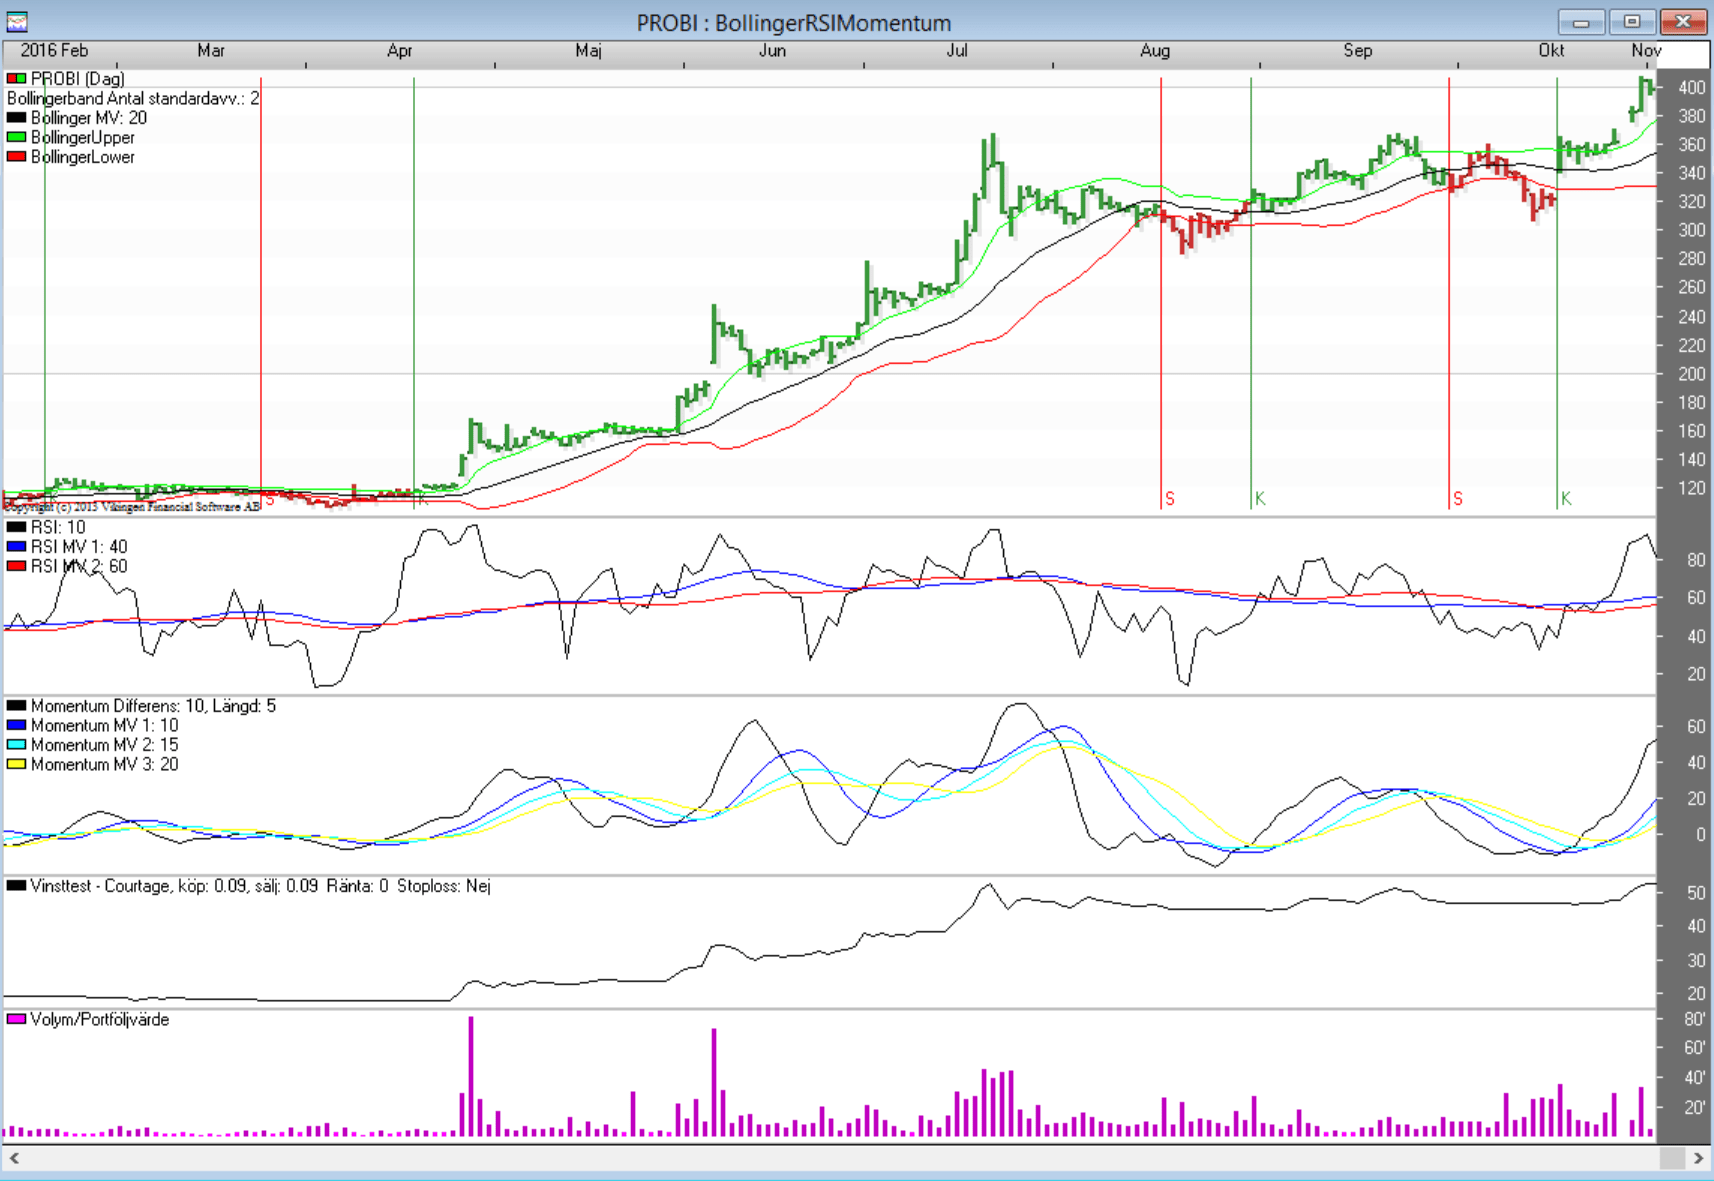
Bollinger band
Shown at the top, it is a model that can be used as a stand-alone model. It is usually enough to stick to this model, which is one of the best in the Viking. The width of the band depends on how much the course swings up and down, when it calms down it is soon time for a new event… “In the calmest of waters…”
When the band around the mean narrows, it is a warning that there may soon be a breakout from the band.
Interpretation: Buy when last paid goes through the top band. The bar changes to green. Sell when the last payment goes through the bottom band.
RSI
RSI is an early warning of what is happening to the price. This model is used in combination with other models.
Shows when the price has gone up or down by an unusual amount. When the Relative Strength Indexis high and turns down, it indicates that the price increase will slow down or stand still or go down. I.e. this means that the price will be relatively worse than in the recent past. This does NOT mean that the price will automatically go down.
When the RSI is low and turns upwards, it indicates that the price decline will slow down, i.e., it’s a good sign. the price may still go down at a slower pace or will stand still or start to go up. I.e. it does NOT mean that the price will automatically go up.
Interpretation: When the RSI is low, it may be a good time to buy or hold. When the RSI is high, selling or not buying can be a good idea.
Best interpretation: Look for formations in the RSI curve whether the RSI is high or low. Double top indicates decline, double bottom indicates rise. Draw trend lines between bottoms and tops and see when they break.
Momentum
Momentum is the change in price over time, i.e. speed. The momentum value, the height of the graph, is equal to the speed at which the price changes. It can be the course difference between 2 days, e.g. today and 5 days ago. Or the current average value minus another average value for e.g.. 10 days ago.
How fast is the exchange rate changing right now, instantaneously? Does the speed change? What has happened to the course on similar occasions?
The appearance of the curve shows how the speed changes, i.e.. acceleration. How quickly the speed increases or decreases.
Should definitely be used with other models. Because the direction of the curve changes so often, there is usually too much trading with this model alone. The idea is to sell when momentum turns negative and buy when it turns positive. To calm down the momentum, it can be smoothed by averaging the momentum. Averaging the momentum means finding the main direction of the momentum curve. The more averages that point in the same direction, the stronger the signal.
Interpretation: Buy when all 3 averages are pointing up and sell when all 3 averages are pointing down.
Profit curve
Shows what you would have earned or lost if you only used Bollinger bands with those settings.
Above it says 50%. Since the curve starts at 100%, this means you have lost 50% if you have always used only Bollinger Bands to buy and sell. A loss indicates that other settings or another model is better suited to this stock. The settings need to be improved (optimized).
BollingerRSIMomentum
In the Viking there is a graph called Bollinger – RSI – Momentum. One might think that it is ONE model with all three models, a multi-model. But this is not the case. The diagram shows all three models at the same time to help you make an assessment when you see how the models interact with each other.
At the bottom of the chart is a profit curve that describes what you could have done if you traded according to the Bollinger Band signals. Below, Nvidia has given just over 50,000%, or 500 times the money in 23 years. Nvidia’s rise has been due to the popularity of Artificial Intelligenceand the need for many computer components for AI.
Bollinger band
The top of the chart shows the Bollinger band. The buy and sell signals depend solely on when the Bollinger Band is broken by the price. Very profitable model, especially with weekly data. The signals are reinforced with Momentum if Momentum rises or falls rapidly. The same applies to the RSI.
RSI, Relative Strength Index
The next model, in the middle, shows the RSI and the mean values of the RSI. A bad way to get buy and sell signals from the RSI is to watch when the RSI breaks any of its averages. This is easily proven with a simulation in Viking Trading where an optimization shows that it is a bad method. It is much better to look at the appearance of the RSI and interpret formations such as the double top and double bottom of the RSI curve. For a buy signal, it is good if the RSI rises. The sell signal in Bollinger Bands is reinforced if the RSI drops.
Momentum
Momentum is advantageously used to detect rapid changes and is popular with day traders. In Sweden, around 99% of all day traders lose money. You may be able to get in and buy at a good price, but you rarely get out with a profit. there are simply too many signals. One way to interpret Momentum is to look for when Momentum breaks its mean, but unfortunately there are often too many signals. For example, when the course is calm, there are too many signals. A better way is to look at the slope of the Momentum, also known as the derivative. A strong upward or downward sloping curve is usually a good signal to buy or sell.
Rising Momentum reinforces the buy signal in the Bollinger Band and falling Momentum reinforces the sell signal when the price breaks out of the Bollinger Band.
Momentum is also good as a warning signal, making you more alert to what is coming. If Momentum takes off, you may want to pay more attention.