How to combine fundamental and technical analysis!
How to Understand Market Psychology and the Language of Prices!
Vikingen and Aktieutbildning.nu with Mikael Hellberg, teaches you how to use technical analysis together with fundamental global analysis!
The original article can be found here, written by Mikael Hellberg, CEO and founder of Aktieutbildning.nu. Mikael Hellberg has over 35 years of experience, and Vikingen has been working with technical analysis for 40 years. Take advantage of this wealth of experience—read on below!
💡 Aktieutbildning.nu has compiled all the knowledge you need for a global stock and fund strategy in this e-book! You also get access to the weekly live webinar “Börssnack”!
Magic happens when you combine the two!
In serious asset management, it’s often said that: “Fundamental analysis tells you what to buy, while technical analysis tells you when to buy it.”
To succeed in the long term on the stock market, it’s not enough to just study charts, nor is it enough to simply read annual reports.
Through Aktieutbildning.nu’s fundamental global analysis, macroeconomics, interest rates, and companies’ actual value are evaluated to identify the strongest markets and stocks. But the market is rarely rational in the short term. It is the actual market participants who set the price, and this is where technical analysis comes into play.
So let’s explore how we can use technical analysis as our financial GPS to time the market opportunities perfectly.
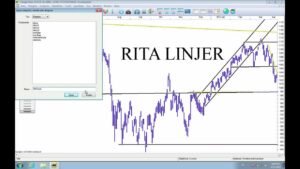
Market Psychology: Sentiment Rules Everything!
The pricing of financial assets takes place between people, and our decision-making is driven largely by emotions such as anxiety, fear, and greed, along with an inherent herd mentality.
This is known as market sentiment. Even the most fundamentally undervalued company can continue to fall if the market is dominated by fear.
To get a sense of the prevailing sentiment, we can use sentiment indicators:
Swedbank Swedish Fear & Greed Index: An index ranging from 0 to 100 that measures whether the Swedish market is driven by fear or greed (with 50 being neutral). This index helps us identify when sentiment has reached extreme levels and a reversal may be imminent.
AAII Investor Survey: A classic sentiment survey in which U.S. investors report their outlook (six months ahead) for the stock market weekly.
When you understand the prevailing sentiment, you also understand how strong the capital flow is, and whether news is likely to be interpreted positively or negatively.

Interpreting the Language of Prices
Once the fundamental analysis has provided us with a list of companies worth buying, and we have gauged market sentiment, we need to look at how the actual price is behaving. There are three key cornerstones here:
Trend: The stock market’s general direction. An uptrend means that prices are forming progressively higher highs and lows. We buy companies with strong fundamentals when they are in a technical uptrend.
Momentum: The rate of price change. Tools such as the RSI (Relative Strength Index) help us determine whether a stock has risen too quickly and become overbought, or fallen too quickly and become oversold.
Broad-based rally: The extent to which the market is broadly participating in a stock market rally. If the index rises but only a few companies are driving the rally, the rally is not broad-based. A broad-based rally is much more stable and sustainable.
Graphical tools to get an overview
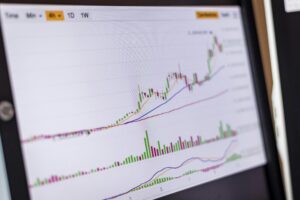
In technical analysis, we visualize the data to quickly see who is in control: the buyers or the sellers.
Candlesticks: Price bars that show the opening, closing, high, and low prices for a specific period. If the body is uncolored (open/green), buyers are in control; if it is colored (filled/red), sellers are in control.
Ichimoku Kinko Hyo: An advanced, yet visually appealing trading system that identifies trends, support, and resistance “at a glance.”
Fishnet: By allowing a large number of moving averages to correlate with one another in the chart, a network structure is created that provides a fantastic overall picture of the underlying trend.
Timing Our Fundamental Choices: Aktieutbildning.nu in partnership with Vikingen!
Finding the best stocks in practice requires powerful tools. We at Aktieutbildning.nu are proud of our close collaboration with Vikingen Financial Software. It’s a financial software program that I’ve personally used for over 30 years, both in the institutional finance industry and in my personal investing.
The BEST Model: Navigating the Stock Market with GPS!
One of the most powerful features in Vikingen (included in the Vikingen Exchange, Trading, and Maxi subscriptions) is the BEST model developed by Peter Östevik. Essentially, it involves quantitative parameter optimization—a process we rely on in professional asset management to make data-driven decisions and filter out emotions.
Instead of having to guess which indicator is best suited for a specific stock, the BEST model lets the computer do the heavy lifting. The BEST model backtests historical data and tailors the exact set of technical analysis that works best for that particular stock. Through the “Tomorrow’s Signals” feature, the model alerts you in advance to the exact price level that will trigger the next signal.
We filter out the fundamentally strongest companies worldwide—and let Vikingen’s BEST model tell us which day to hit the buy button!
👉 Learn about Vikingen and the BEST model in the course: Vikingen—A Program for Technical Analysis
👉 Vikingen’s Top 10 Buy Signals, automatically generated from the BEST model!

Vikingen has been around for 40 years and is constantly evolving!
Tell your friends and colleagues to subscribe to our newsletter to be the first to know!
Check out what Mikael Hellberg has to say about Vikingen and how he uses the program (2-minute video)!
Read about Vikingen’s various software packages and what’s included. For the Vikingen Mini, Exchange, and Trading programs, you can also purchase the add-ons that are most useful to you.
See all the add-ons here. All add-ons and models offered by Vikingen are included in Vikingen Maxi.
Here you can access free training courses on Vikingen Mini, Exchange, Trading, and Vikingen Maxi programs.
Vikingen Financial Software reminds you that past performance is not always an indication of future returns and that all trading is at your own risk.
Yours sincerely