Commodities Super Cycle: Is it time to follow the trend?

o We characterize the recent price increases in commodity markets as a long-term return to what would be “fair value” relative to global equities.
o If history is any guide, this current commodity cycle could persist for several years, suggesting that investors may want to consider diversifying their portfolios to protect against a burst of price inflation.
o If commodity markets continue to move higher and central banks realize their goal of higher inflation, a trend-following strategy that takes positions in all asset classes may be worth considering.
For the first time in many years, the words ‘raw material’ and ‘supercycle ‘ are used in the same sentence. In this article, we will review the recent moves higher in commodity markets in a longer-term context, the sustainability of the tailwinds supporting this and consider whether this is indeed the start of a longer-term cycle market. Is it time for commodity markets to shine?
We will also look at the implications of a continued breakout in commodity markets and how the application of a time series momentum (strategy to follow) can take advantage of changes in commodity market regimes and provide a potential hedge against inflation for a portfolio.
The global stock/commodity cycle
Commodity markets have well-defined cycles over time, and this is particularly evident when looking at the relative returns of commodities compared to other growth assets. The measure we have used for several years to highlight the cyclical nature of commodity markets compares the rolling five-year annual returns of global equities and commodities (Chart 1). The series is mean reverting and highlights the points at which commodity markets are relatively “cheap” compared to global equities. This is best explained by underinvestment in commodity markets creating a cyclical downturn and possible oversupply at the end of a cycle.
The potential for an average rebound in commodity prices is significant
Rolling five-year annualized excess return: commodities vs MSCI World
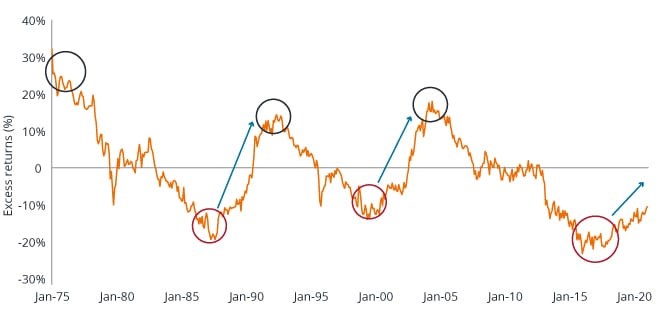
Source: Janus Henderson Investors, Morningstar, January 1, 1975 to December 31, 2020. Note: Equities are represented by the MSCI World Net Total Return USD Index, commodities are represented by the GSCI from January 1970 to December 1990 and the BCOM commodity index from January 1991. Past performance is not a guide to future performance.
It is also notable that this action typically leads or delays peaks and troughs in both commodity and equity markets, with commodities reaching a cyclical peak in mid-2004 (four years before commodities peaked) and bottoming out in December 2015, a number of years earlier to the lows of March 2020.
Although there has been a recent surge in a new commodity supercycle, we would instead characterize the recent surge in commodity markets as a long-term return to what would be “fair value” relative to global equities. Whether or not this is the start of a super cycle is less relevant than the simple fact that if history is any guide, this current cycle of commodities outperforming global stocks should persist for a number of years. In our view, this provides an attractive option for investors looking to diversify portfolios and protect against a burst of commodity price inflation.
Long-term cycles in US dollars
A second consideration when looking at the future evolution of commodity markets is long-term cycles in the US dollar, where all major commodities are still traded. This relationship is straightforward; commodity prices tend to rise during periods of relative US dollar weakness because these commodities are cheaper in local currency terms. Chart 2 shows this long-term relationship, with the most recent basing in commodity markets occurring in March 2020. From this base, commodity markets have increased by just under 70% (as of February 24, 2021) combined with an approximate 9% correction in US dollar terms.
The relationship between the US dollar and the commodity cycle
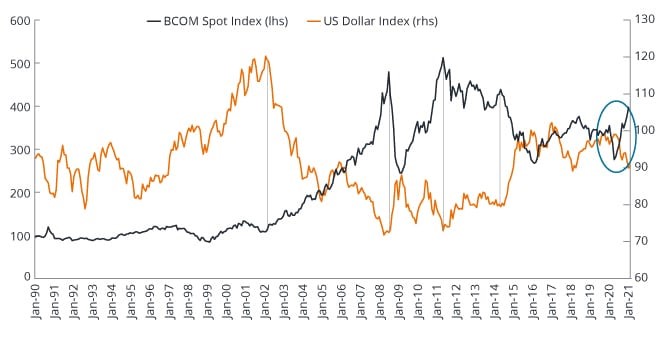 Source: Janus Henderson, Bloomberg as of December 31, 2020. Note: The Bloomberg Commodity Spot Index (BCOMSP – shown on the left axis) tracks the prices of futures contracts on physical commodities in the commodity markets. The ICE U.S. Dollar Index (shown on the right axis) measures the value of the U.S. dollar relative to a basket of foreign currencies (euro, Japanese yen, pound sterling, Canadian dollar, Swedish krona and Swiss franc). Past performance is not a guide to future performance
As with commodity markets, cycles in the US dollar tend to take a number of years to play out; if the absolute base for commodity markets during this cycle was March 2020, then a sustained weakening of the US dollar would provide a significant and positive tailwind for commodity markets more broadly.
A final observation supporting the hypothesis that commodity markets have entered a new bull market is gleaned from seforwarding the curve for each commodity market and the BCOM index as a whole. The positive change in supply-demand fundamentals across the commodity complex is illustrated by the positive roll yield now available to commodity investors (currently just under 4%).
Chart 3 shows the historical one-year return on the index (sector-weighted), currently at its highest level in over 15 years, with broad-based lagging evident in most underlying commodities. The current backwardation level acts as a meaningful tailwind in the absence of market shocks. While commodities bottomed out relatively at the end of 2015 (per Chart 1), the negative oil price that occurred in April 2020 was very likely the absolute base of this commodity cycle. To misquote T.S. Eliot: “This is how commodities market the bottom, not with a whimper but a bang.”
BCOM has seen its lowest and highest one-year returns in 15 years
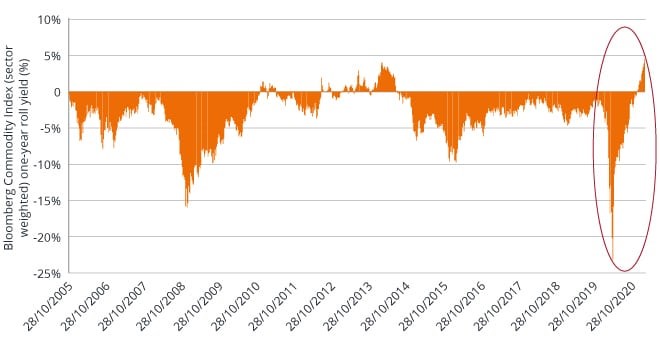 Source: Bloomberg, Janus Henderson, October 28, 2005 to February 26, 2021. Past performance is not a guide to future performance.
Are the catalysts for a ‘supercycle ‘ in place?
Long-term cycles provide a broad top-down view of the potential forward direction of commodity markets, but this in itself does not provide the fundamental basis for a sustained increase in broad commodity markets. A true multi-year bull market cycle in commodities requires sufficient catalysts where a demand shock occurs during a period of inherent supply constraints. Without giving a detailed picture of these factors, we believe that the current environment offers the potential for higher prices in the main commodity markets that make up a large part of the commodity indices.
The following drivers support a hypothesis of a multi-year bull market cycle in commodity markets:
o The effect of a sustained increase in demand for raw materials needed to electrify the electricity grid (demand) against supply constraints in these commodities due to exploration, declining ore grades and a lack of large discoveries.
o The potential demand shock from major economies reopening after mass vaccinations.
o ESG considerations that could potentially affect future available stocks of key commodities.
o A willingness of most major central banks to allow inflation outcomes to remain above the upper bound to achieve a desired inflation outcome.
The potential for a sustained and broad-based increase in commodity prices increases the potential for higher and sustained inflation over the medium term.
In an environment of sustained increases in commodity prices and a potential eruption of inflation, is there an anti-fragile strategy that takes advantage of this potentially difficult market order?
Persistent inflation and its impact on real yields
Commodity markets are one of the main sources of cost-push inflation. the current system of central bank accommodation and a desire to achieve ever-higher inflation has the potential to erode the real return on financial assets. There have only been a handful of these environments in the last 100 years, the last of which was in the 1970s. The inflation floor remained at 3% during this period, with two periods of breakouts coinciding with increases in commodity prices – in particular oil and gold. While real returns for both equities and bonds were negative during this period, commodity markets produced particularly strong returns.
US CPI Urban Consumers (year on year) inflation (%)
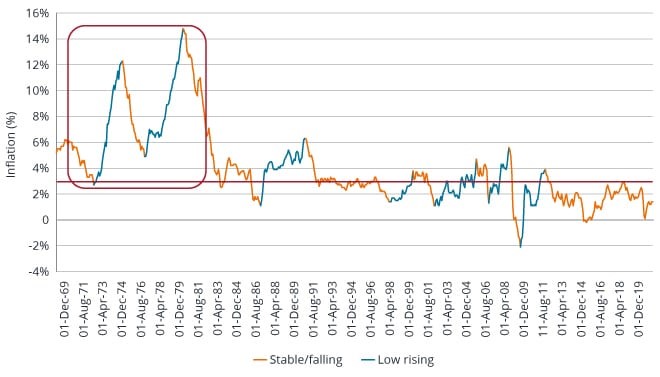 Source: Bloomberg, Janus Henderson Investors, March 31, 1969 to January 31, 2021. Past performance is not a guide to future performance.
Central banks are currently adopting a strategy that is extremely accommodating to liquidity and accepting higher levels of inflation for a sustained period. While there is no guarantee that central banks will achieve their goal of gradually increasing inflation, there is a potential for inflation to erupt in a disorderly fashion. In such an environment, is there a strategy that takes advantage of this regime change and can potentially protect against the loss of real returns on financial assets during a sustained period of commodity price inflation?
Trend following: a potential solution to protect against lasting inflation
In a broad-based, multi-year commodity market cycle, a trend-following strategy is a potential tool that could help mitigate the erosion of real returns other asset classes. The trend following has well-documented potential to generate “crisis alpha” in lasting market shocks across all major asset classes.
It is possible to provide some context around the potential for such a strategy to provide dynamic protection for a diversified portfolio in an environment of rising inflation. Looking at the same period of higher inflation in the 1970s, we model a simple trend-following strategy on a commodity index and include a 5% allocation to commodities with the remaining 95% allocated to a theoretical 60/40 portfolio. The strategy takes directional positions (long/short) on the commodity index, based on 12-month price momentum, i.e. long (short) positioning where current prices are higher (lower) than 12 months ago.
As shown in Chart 5, this modeling strategy would have offset some of the effects on the periods of higher inflation.
A trend-following allocation to commodities – impact on real returns
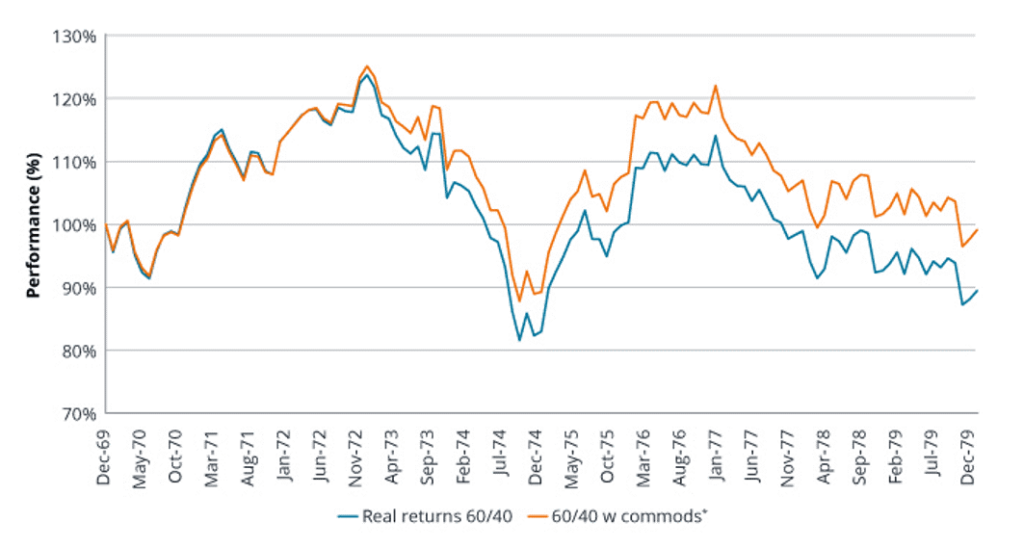 Source: Bloomberg, Janus Henderson Investors, June 30, 1972 to February 29, 1980. Resets to 100 at start date. Past performance is not a guide to future performance. * Note: The indices used for equities, FI and commodities are as follows: Equities: Ibbotson SBBI USA Large Cap Equities (Total Return) FI: Ibbotson SBBI US Intermediate Maturity (5 years) Government Bonds (Total Return) Commodities: S&P Goldman Sachs Commodity Index (Total Return) The hypothetical performance shown in this model is illustrative only and does not represent the actual performance of any client account. No accounts were managed using the composition of the portfolio for the periods shown and it is not apparent that the hypothetical returns would be similar to the actual performance.
The cyclical nature of the commodity market, combined with current fundamentals, provides a tailwind for commodity markets to stay higher over a longer time horizon. However, this positive backdrop brings with it the potential for a sustained increase in inflation, supported by central banks content to implement policies that seek to achieve higher consumer price index (CPI) levels in several years. In this environment, a trend-following strategy that takes positions in all asset classes including commodities has the potential to provide a high degree of protection to a diversified portfolio that would typically be adversely affected by such an environment.
This text will be followed up with another article next week.
Trade Centaur Commodity Fund
Centaur Commodity Fund is available through most fund platforms, but also through most online brokers, such as
Avanza
and
Nordnet
.
About the Vikingen
With Vikingen’s signals, you have a good chance of finding the winners and selling in time. There are many securities. With Vikingen’s autopilots or tables, you can sort out the most interesting ETFs, stocks, options, warrants, funds, and so on. Vikingen is one of Sweden’s oldest equity research programs.
Click here to see what Vikingen offers: Detailed comparison – Stock market program for those who want to get even richer (vikingen.se)