Betsson gave 21 times the money!
The last buy signal in Betsson came one year ago and you could have bought the share for SEK 65. The price now stands at around SEK 110, i.e. an increase of around 70 percent. A good return in one year, isn’t it?
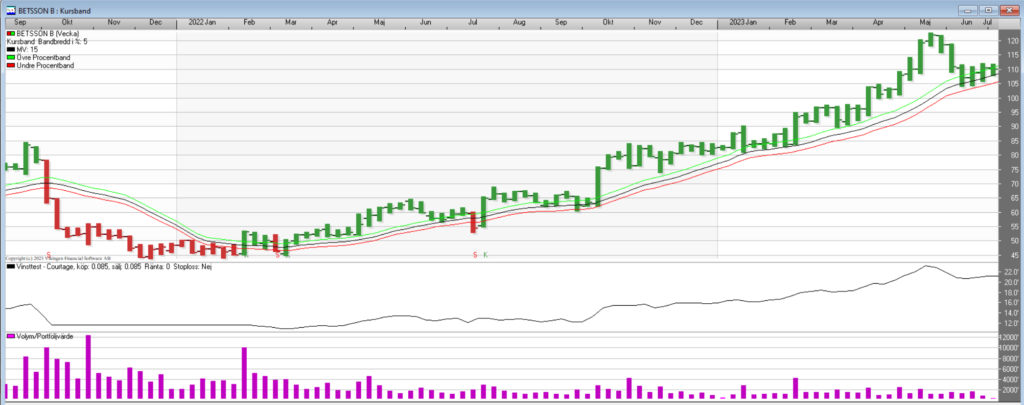 Source: Vikingen.se
The diagram comes from the stock exchange program Vikingen, which is one of Sweden’s oldest stock exchange programs – there are reasons why the program is still used after almost 40 years. The program does its job well. But how does it work? The chart shows a number of red and green bars. When these turn red, it means that there is a greater risk of decline, known as a sell signal, an indication that it may be time to sell.
When the bars turn green, there is a better chance that the price will start going up. We call this a buy signal. But can a computer really know whether the price will go up or down? Of course not, but it’s a good guess. If nothing unusual happens, the tip will come true many times. Think of it as the computer giving you tips.
In the chart above, there is a model called the ‘price band’ that gives you tips on whether to sell or buy. There is a mean value in the middle and next to that mean value there are two other lines that follow the mean value. When the price goes outside the band, it triggers a buy or sell signal.
Everyone knows that prices go up or down in small increments. By putting a band around the course, we avoid the noise Course bands are a good way to filter out unnecessary signals. The larger the band, the fewer signals and vice versa.
Price bands are an excellent model to use on slow-moving stocks or funds. A long-term model. In the example above, you could have made 21 times the money in Betsson if you looked at the Viking’s signals once a week.
But how can you find the next stock market winner? Firstly, it is good to understand which industries are doing well or you think will do well.
In Viking it is possible to obtain about 50 different key figures. This is what it looks like for Betsson:
Wow, that’s a lot of numbers, but you don’t need to know them all. With Viking’s stock exchange program, you can rank the different companies against each other. The Viking is one of the few programs that can do this. There are special filters that bring out the best tips every day.
The Viking provides you with a daily list of stocks that you can assess using the Price Band and other models. You can see more than a computer can see, you can also see which way it is leaning, you can see the smooth movements in a graph more easily than a computer can.
Unfortunately, things happen that are difficult to predict, such as wars, interest rate increases, etc. Therefore, it is good to supplement with buy and sell signals and stop losses to help you sell in time.
Of course, it is good to buy a number of shares, ETFs and mutual funds to reduce risk. Maybe 15 different securities. “Let the profits run and cut the losses short” is a very good basic rule.
Tired of missing all the good deals on the stock market?
Vikingen, Sweden’s oldest stock market program, helps you find stock market winners and sell in time! You can quickly see which stocks are worth buying and which are going down.
Viking’s smart filter gives you daily suggestions for the best stocks right now.
Try the Viking at half price!!! Works on PCs and MACs.
(All MAC-OS works but not the M2 processor, then it can be run with the add-on program Crossover which costs 74 dollars).
Order on Vikingen.se
and enter the discount code
“Betson”
. Valid for 2 weeks. Take care now.
Vikingen Börs for SEK 185 per month or SEK 1,850 for a year. That’s five kronor a day to avoid seeing the stock market go up without you being on the train.