This Week’s Analysis with Aksjeanalyser.com and Vikingen!


In this week’s analysis, Aksjeanalyser.com takes a closer look at the giant on the Oslo Stock Exchange:
Equinor ASA (ticker: EQNR)
Equinor today (July 22) reported its second-quarter results, and the company was able to present very strong results.
Aksjeanalyser.com has taken a closer look at the technical picture for Equinor stock now suggests regarding its future performance. Read more about this below in the technical analysis of Equinor (EQNR).
About Equinor ASA
(ticker on the Oslo Stock Exchange: EQNR)
Equinor ASA is engaged in the exploration, production, transportation, refining, and marketing of petroleum and petroleum products. The company operates through the following segments:
– Exploration and Production Norway
– Exploration and Production International
– Exploration and Production USA
– Marketing, Midstream, and Processing
– Renewable Energy and Other
The Exploration and Production Norway segment encompasses the commercial development of oil and gas portfolios on the Norwegian continental shelf. The Exploration and Production International segment covers offshore and onshore activities in the United States, Mexico, and other operations globally. The Exploration and Production U.S. segment covers both onshore and offshore exploration, development, and production of oil and gas in the United States. The Marketing, Midstream, and Processing segment markets and trades crude oil and condensate, natural gas, NGL, and refined products. The Renewable Energy segment focuses on offshore wind and integrated solutions for onshore renewable energy. The Other segment includes projects, drilling and procurement, the Technology, Digital, and Innovation business area, as well as corporate staff and support functions.
The company was founded on September 18, 1972, and is headquartered in Stavanger, Norway.
Equinor ASA (EQNR) has a market capitalization of 88.2 billion USD at today’s share price. For more information about the company, visit their website here.

Technical Analysis of Equinor ASA
(ticker on the Oslo Stock Exchange: EQNR)
Equinor stock is once again showing strong performance within a long-term uptrend.
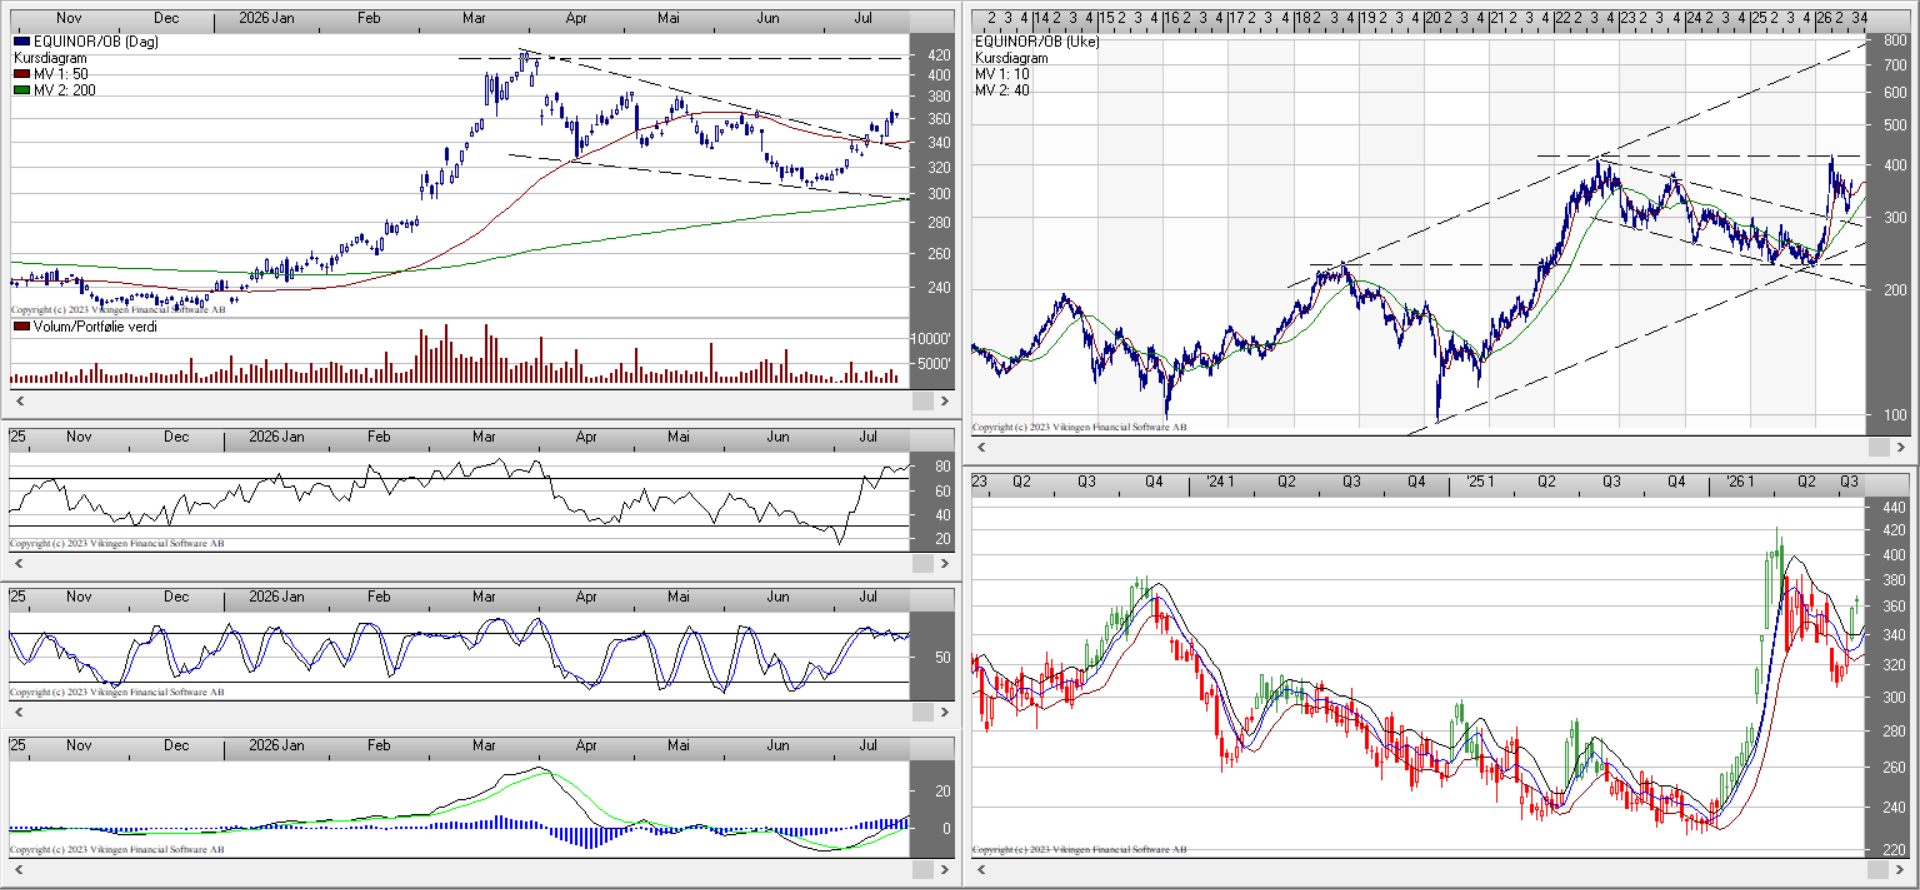
After correcting downward from its peak of around NOK 420 in late March 2026 to around NOK 300 in late June 2026, the stock is now on the rise again.
The stock rebounded from the NOK 300 level and was then close to the important and significant technical support level near the 200-day moving average.
The stock has now broken above its 50-day moving average again, thereby triggering new positive technical signals for its future price performance.
The stock has also broken out of a large descending wedge consolidation pattern (formed between March 2026 and June 2026), and furthermore, it has broken above a key technical resistance level around NOK 340.
The overall technical picture points to further gains ahead for Equinor stock, and the first technical resistance level will now be around the previous high in the NOK 420 range.
If the price breaks above the NOK 420 level, there will be little technical resistance to a further rise in Equinor’s stock price (see weekly chart).
The BEST model in Vikingen has also issued a buy signal for Equinor ASA again.
This popular and effective technical analysis model was developed by Peter Östevik. He completed the the BEST model around 2019, drawing on 30 years of experience with technical analysis and Vikingen Financial Software.
Based on the overall positive technical picture that Equinor stock is now showing, Aksjeanalyser.com believes that the stock may have significant potential over the next 6–12 months.
The only thing that could potentially change the currently very positive technical outlook for Equinor stock would be if the stock were to fall back below the 200-day moving average and below the NOK 300 level.
Equinor stock is trading today, Wednesday morning, July 22, 2026, at around NOK 367.

What’s the best thing to buy right now?
Vikingen has the answers!
When you have Vikingen Exchange, Vikingen Trading or Vikingen Maxi you get the BEST model. All Vikingen programs help you make wise decisions when it’s time to buy and sell. You can easily track trends, find good buying opportunities, and monitor risk and stock market activity for your own investments.
Here you can read about Vikingen’s different software packages and what’s included. For the Vikingen Mini, Exchange, and Trading programs, you can also purchase the add-ons that are most useful to you. See add-ons here. All add-ons and all models offered by Vikingen are included in Vikingen Maxi.
Here you can check out free courses on Vikingen’s programs Mini, Exchange, Trading, and Vikingen Maxi.
And don’t forget to tell your friends and colleagues to sign up for our newsletter. Vikingen has been around for 40 years and is constantly evolving. A new service is launching soon!
Vikingen Financial Software reminds you that past performance is not always indicative of future profits, and that all trading is at your own risk.
Yours sincerely