Bollinger Band
Description:
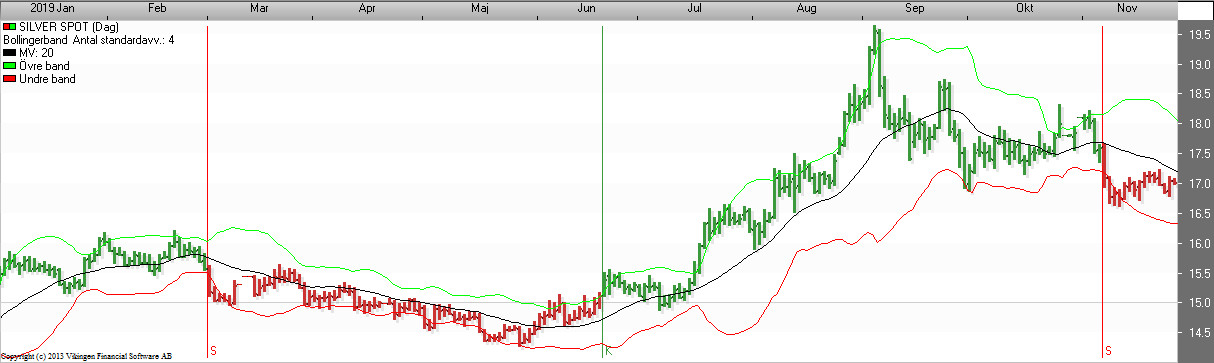
Developed by John Bollinger. The Bollinger model is a model that allows the user to compare volatility and price levels over a period of time. The model consists of three graphs, designed to encompass the bulk of a stock’s price movements.
- A simple moving average in the middle.
- An upper band (the moving average + 2 standard deviation)
- A lower band (the moving average – 2 standard deviation)
The standard deviation is a statistical term that provides a good indication of volatility.
Trading bands are lines drawn at a fixed distance (in %) from a moving average. The principle is that a stock usually moves within a predictable range on both sides of a moving average.
Bollinger Bands vary in distance from the moving average based on volatility. The upper band is one standard deviation above the moving average. The lower band is one standard deviation below the moving average.
Since the standard deviation is a measure of volatility, the Bollinger bands adjust to the prevailing market conditions. They expand during volatile market conditions and contract during less volatile periods (consolidation). They become moving standard deviation bands so to speak(Alpha-Beta Trend Channel).
Bollinger Bands are displayed graphically along with a third line. This is the moving average.
The period for this can vary. However, Mr. Bollinger recommends 10 days for short-term trading and 20 for slightly longer-term trading (3 months); 50 days are used for the long-term perspective.
Furthermore, the value of the standard deviation can be varied. Many technical analysts increase the value from 2 to 2½ standard deviations when using a 50-day moving average. Similarly, the value is sometimes reduced to 1½ when using a 10-day moving average.
Interpretation:
In general, look for buying opportunities when the price is at the lower band, and look for selling opportunities when the price is around the upper band.
Interpretation according to John Bollinger
Strong movements tend to occur after the bands have contracted towards the moving average.
A movement outside the bands suggests a continuation of the trend.
Peaks and tro ughs outside the bands, which are followed by peaks and troughs inside the bands, indicate a reversal of the trend.
A movement in one band tends to be matched by a similar movement in the other band.
A strength sign appears when a stock is hitting the lower end of its upper band.(The Price Band model is based on this).
A turnaround in price development, or a consolidation, often does not occur until the upper bollinger bands have been broken a couple of times.
Important:
It is good to keep in mind that Bollinger bands do not generate buy or sell signals alone. They must be combined with some other indicator/model.
Personally, I prefer to use Bollinger bands together with RSI because when the price reaches one of the bands it means one of two things. This could mean that the trend continues or it could mean that an opposite reaction is coming.
When combined with the RSI, this provides a powerful indicator of overbought or oversold conditions.
(The RSI is an excellent indicator of overbought and oversold conditions.)
| Between 30 and 70: Generally speaking, when the price reaches the upper Bollinger band and the RSI is below 70, this indicates that the uptrend will continue. Similarly, when the price reaches the lower band and the RSI is above 30, the downtrend is expected to continue. Above 70 or below 30: If we encounter a situation where the price reaches the upper Bollinger band and the RSI is above 70 (approaching 80), this indicates that the uptrend will reverse and turn downward again. Correspondingly, when the price reaches the lower band and the RSI is below 30 (approaching 20), we have an indication that the downtrend will be replaced by an uptrend. |
 |
Other indicators together with Bollinger bands:
Avoid using other indicators that rely on the same input data. For example, if you’re using RSI, you shouldn’t use MACD as well. They use the same input data.
Instead, you can use On Balance Volume or Money Flow. They measure different things and can be used as further confirmation of a trend. The technical term for this is “Avoiding Multicollinearity,” and I won’t be explaining that term here.
Bollinger Bands can be used in conjunction with RSI, MACD, CCI and Rate of Change. It is the differences between Bollinger Bands and other indicators that constitute the potential entry points.
How to set the Bollinger band model correctly for an individual stock:
You can choose to use Delphi’s optimal parameters. They should be set to give you the highest profit if you want to act on all signals.
You can optimize the model yourself to get the signals you want. For example, a short-term trader might want more signals (and higher risk) than a more long-term investor.
John Bollinger himself recommends using the 20-day moving average as the standard and 2 as the standard deviation of the mean.
To properly set the Bollinger bands for an individual stock, you change the length of the moving average. The observant will already have noticed that the Bollinger model, shown above along with the RSI, is not properly set up. The correct setting should support the second (higher) bottom after a recoil.
If the second (higher) bottom remains above the lower band, the moving average is too short.
If the second (higher) bottom remains below the lower band, the moving average is too long.
When the lower band supports the second (higher) bottom, the moving average is set correctly.
So you start by setting the STD to 2 if you have 20 days of average, 2.5 if you have 50 and 1.5 if you have 10 days of MV. Then you change the length of the MV until you think it fits as in the picture above.
If you run a backtest, you’ll find that you don’t get the same returns as with Delphi’s optimal parameters.
This isn’t a mistake, since you shouldn’t act on buy and sell signals based solely on this model—which is what the optimal parameters are intended for. If you want to do that, it’s a good idea to look into optimization, etc.
Source: Per Holmlund and F1 in Vikingen and Greger.
BOLLINGER BAND
One of the best models because it is so accurate and eliminates many unnecessary transactions. There are buy and sell signals when the price breaks out of the band and the beauty is that the width of the band adapts to how much the price moves. In times when the price fluctuates a lot, the band becomes wide and when it is calm, the band is narrow.
When the price is ‘choppy’, i.e. when volatility is high, there is a high risk of buying and selling too many times. You want to be there when it goes up and you want to sell if the price goes down a lot. But in such troubled times, it can be a good idea not to trade and wait out the storm until the market has made up its mind. That is, you only act when the band has become narrow and the price breaks out.
The width of the band can be set by choosing the length of the average and how much the band should deviate from the normal price difference, or as we say in analyst language, the standard deviation. The model calculates the normal price difference over the period and then enters a multiplier times that standard deviation, usually 2.
Interpretation
When the band is wide, you can expect the price to move in the opposite direction when the price is near a band. It becomes a support or resistance.
When the band is narrow, you can expect an eruption to occur soon. People get impatient, they wait for something to happen and eventually they can’t take it anymore and take action. Then the outbreak repeats and is amplified if many people do it at the same time. As you can see in the image below with SEB bank, there are few transactions when using weekly data. Total in this example 85 times the money in 43 years. The Viking has long data series.
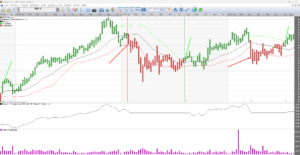
Using the optimization in Viking Trading, it would be 150 times the money in the same time with the settings of 16 weeks and standard deviation 3.6.
Having good values goes a long way!
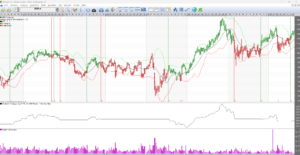
Best settings of the Bollinger Band
An optimization calculated on the most traded shares in the Nordic region, about 175 shares, gave on average the following best settings:
| Period | Average | Number of standard days |
| Day | 18 | 3 |
| Week | 9 | 2 |
| Month | 4 | 1 |
The daily data was similar to the default setting, 20 and 2, while the weekly and monthly data differed significantly.
The model in detail


