Commodity Channel Index (CCI)
Description:
The CCI was developed by Donald Lambert. The CCI was designed to identify reversals in the trend of commodities. However, the model is not limited to commodities alone but can also be applied to shares. The purpose of the CCI model is to use it as a timing tool that can identify buying opportunities when a breakout occurs and keep the trader out of the market when it goes sideways. More specifically, this model measures how high or how low the exchange rate is relative to its statistical median. A high value means that the price is relatively high and a low value means the opposite. The model includes an oscillating graph that moves from + to +1 or from 0% to 100%.
CCI is best suited to stocks with a cyclical pattern.
Interpretation:
CCI can be interpreted in several ways and incorporated into many different trading types or philosophies, depending on the type of commodity or stock, as well as the time period being analyzed.
A first way is to use the CCI as an overbought/oversold oscillator. When the CCI is in its upper range and continues past +100, it is overbought and a correction is imminent. When the CCI is well into its lowest level area and moves below 200, a rally is imminent.
A second interpretation is that when the CCI enters a 3-digit range, the trend will continue.
When the CCI is above +100, it is a “bullish” signal.
When the CCI is below 200, it is a “bearish” signal.
Critics of the CCI say that the model often misses the initial part of a price movement, and to get around this, some traders use the actual crossing of the zero line as a buy or sell signal.
When the CCI crosses the zero line from negative to positive, it is a potential “bullish” signal.
When the CCI crosses below zero from positive to negative, it is a potential “bearish” signal.
A third interpretation is to integrate the two opinions into one and look for divergences as the determining factor.
Example:
If the price continues to reach new highs and the CCI does not, the stock is potentially oversold. With both reaching new highs, an upward trend may be imminent. The reverse is true when the price reaches new lows over a period of time.
The CCI is calculated as follows:
- Identify the cycle of the file. For the sake of calculation, let’s say it’s 60 days (there are about 60 days between two bottoms).
- Lambert recommends using 1/3 of the cycle time as the period in the CCI. That would be 20 days.
- We calculate today’s Typical Price (TP) = High + Low + Close (H+L+C)/3.
- Next, the 20-day simple moving average of the typical price (SMATP) is calculated.
- Next, the mean deviation is calculated. How is that done?
Well, here’s how; first you calculate the absolute value of the difference between the current SMATP and TP for each of the last 20 days. Then add all these absolute values to a sum and divide it by 20. The result is the Median Deviation. - Finally, we insert these values into the CCI formula, together with a constant (0.0015).

- Lambert set the constant at 0.0015 so that about 70-80% of the values of the CCI would fall between -100 and +100.
The CCI oscillates around 0 and the number of % falling between -100 and +100 depends on the number of periods used.
A shorter CCI is more volatile and a smaller % of CCI values fall between -100 and +100.
Conversely, the more periods used to calculate the CCI, the higher the percentage of CCI values that will fall within the range of -100 to +100. Lambert’s trading strategy for the CCI focuses on movements above +100 and below -100 to generate buy and sell signals. Since approximately 70–80% of the CCI’s values fall between -100 and +100, a buy or sell signal will only be valid about 20–30% of the time.
When the CCI breaks above +100, the stock is considered to be in a strong uptrend, and a buy signal is generated. The sell signal is triggered only when the CCI breaks back below +100.The CCI should ideally be used in conjunction with other models and standard chart pattern analysis.
The values -100 and +100 are not fixed; they likely need to be adjusted slightly for each stock. Sometimes +75 may work better than +100. What works for one stock does not necessarily work for another. Most often, you’ll need to rely on a subjective assessment to adjust the levels “by eye” until you’re satisfied.
In Viking we have Delphi’s CCI (DCCI).
Description:
DCCI is used to identify trend reversals.
High values are considered to indicate strength and low values are considered to indicate weakness.
The DCCI is calculated as follows:
1) an average, A, is taken of the closing, highest and lowest price,
2) a mean value, B, is taken on the mean value A above,
3) the difference between A and B is calculated; and
4) the difference thus obtained is divided by a number to obtain comparable figures.
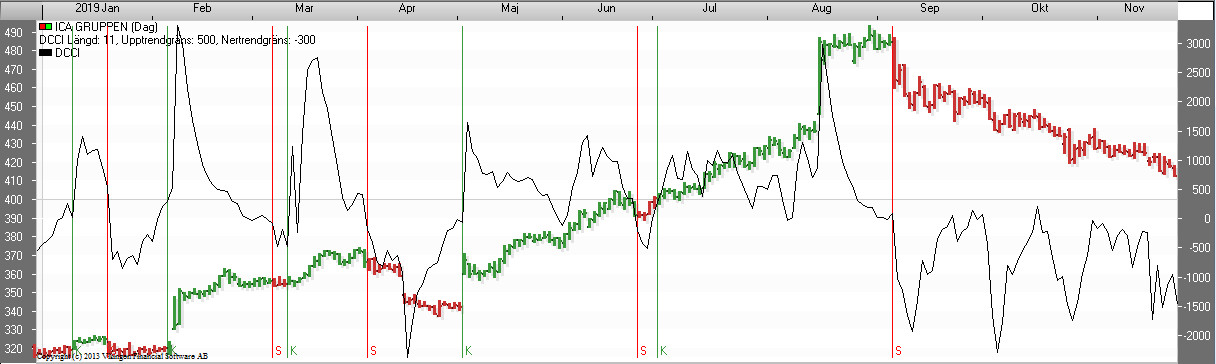
Buy signals are given when the DCCI exceeds the “Up Trend Limit”, sell signals when the DCCI falls below the “Down Trend Limit”.
Settings:
DCCI length = the number of periods on which the DCCI is calculated.
Uptrend limit = level that the DCCI must exceed for a buy signal.
Downtrend limit = level below which the DCCI must fall for a sell signal.
Interpretation:
DCCI is used to identify reversals in the trend.
High values are considered to indicate strength and low values are considered to indicate weakness.
Buy signals are given when the DCCI exceeds the “Up Trend Limit”.
Sell signals are given when the DCCI falls below the “Downtrend Limit”.
Settings:
DCCI period = the number of periods used to calculate the DCCI.
Uptrend threshold = the level the DCCI must exceed to generate a buy signal.
Downtrend threshold = the level the DCCI must fall below to generate a sell signal.
DCCI “Delphi Cycle Channel Index”
DCCI works best in a trend, up or down. It lets out unnecessary signals when the curls are trending.
On a daily basis, the model gives an early signal when the trend reverses. It makes a difference whether you choose daily, weekly or monthly data. For example, the result for Balder B 1999-10-12 to 2023-09-18 (24 years) was loss -62% with daily data, profit with weekly data 3200% and profit with monthly data 400%. But how do you know what to choose in advance?
Here’s a trick: Buy when the monthly model gives a buy signal and sell when the weekly trend is broken. Or if you’re just doing daily data, trade on the buy signal on the daily chart and sell when the daily trend breaks.
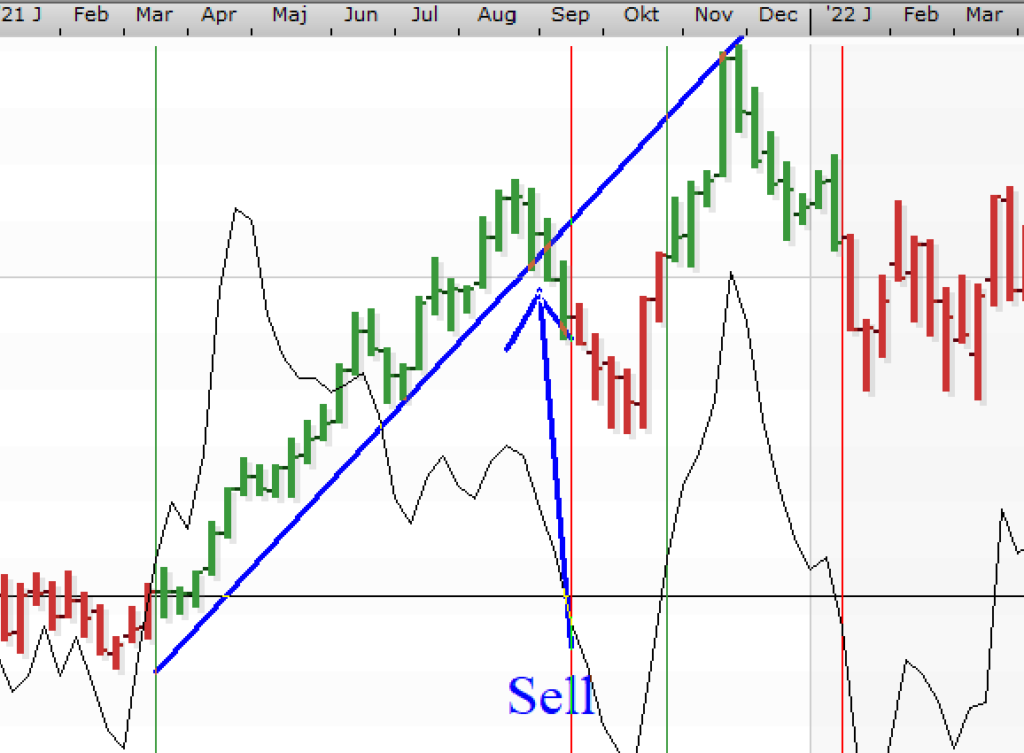
More examples with Delphi Channel Cyclic Index, DCCI
Too much business at a standstill. The monthly model sells and buys at the right time. Unfortunately, the sell signal comes too late sometimes, as a lot can happen in a month. Should be combined with selling when the uptrend or support is broken in the weekly model. The big advantage is that the model with monthly data does not buy or sell unnecessarily when the stock is trending up or down. The first time there is a sell signal, you do not know in advance if it will be a rectangle, but you have to follow the first sell signal and then the first buy signal in the weekly chart.
In general, it can be said that the buy signal in the monthly chart with the DCCI model is really good, it gives a good chance for a profit.
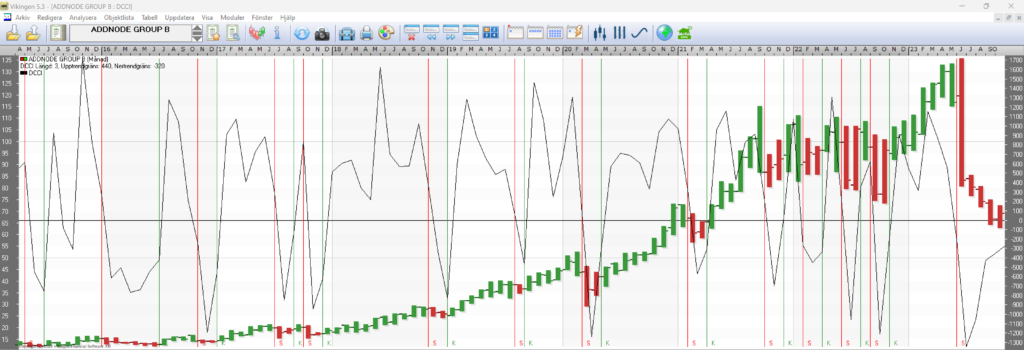
Image above DCCI with monthly data
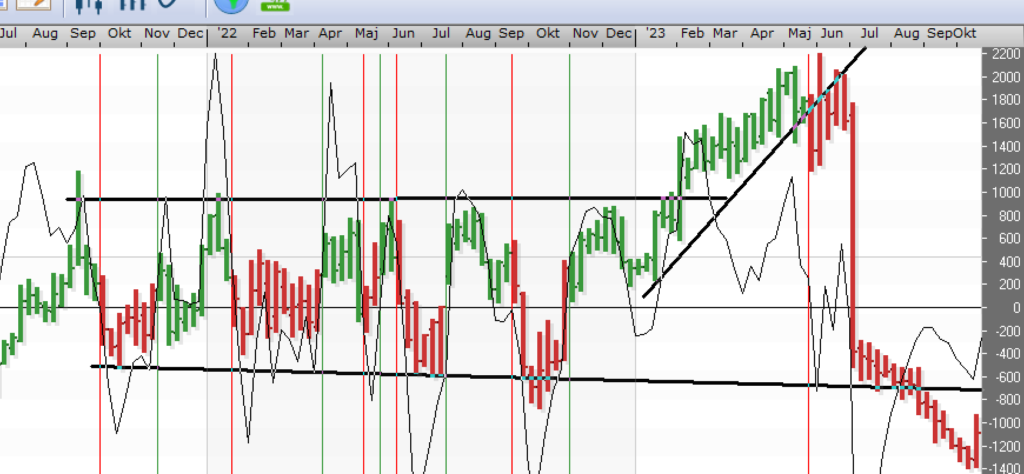
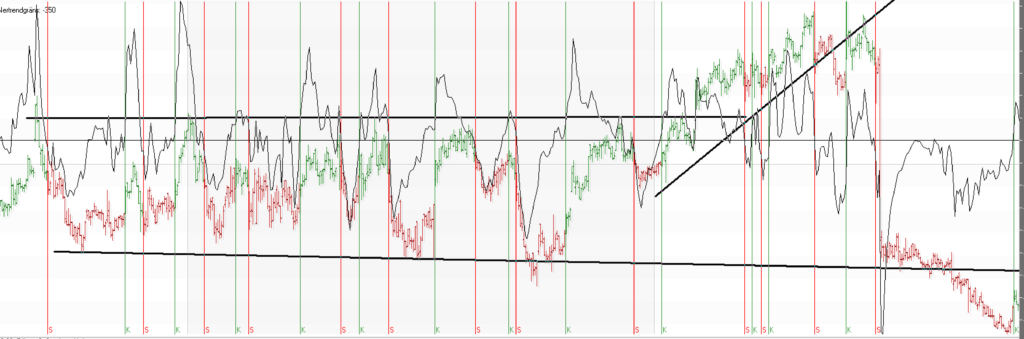
If you want something fun and interesting, you can follow the signals in the daily chart, but it is doubtful that the signals in the daily chart will be profitable.
Good settings
An optimization of the 325 most traded stocks yielded the following best settings on average:
| DCCI Length | Uptrend Limit | Downtrend Limit | |
| Day | 13 | 537 | -298 |
| Week | 9 | 503 | -296 |
| Month | 5 | 492 | -296 |
Description
DCCI is used to identify trend reversals.
High values are considered to indicate strength and low values are considered to indicate weakness.
The DCCI is calculated as follows:
1) an average, A, is taken of the closing, highest and lowest price,
2) a mean value, B, is taken on the mean value A above,
3) the difference between A and B is calculated; and
4) the difference thus obtained is divided by a number to obtain comparable figures.
Buy signals are given when the DCCI exceeds the “Up Trend Limit”, sell signals when the DCCI falls below the “Down Trend Limit”.
Settings:
DCCI length = the number of periods on which the DCCI is calculated.
Uptrend limit = level that the DCCI must exceed for a buy signal.
Downtrend limit = level below which the DCCI must fall for a sell signal.
Background
The first version of the Vikingen stock exchange program was created by Delphi Economics, which started in Uppsala and continued in Stockholm. Hence the word ‘Delphi’.


