BEST
The BEST model was created by Peter Östevik from Sweden. It was completed around 2019 after 30 years of experience. The model is a further development of Peter’s Specializer and the Optima model. Peter’s specializer is designed mostly for intraday and day rates. The BEST model is best suited with monthly data, but weekly data can also work.
But where does the name BEST come from? Simply because it is the model that works best in combination with support, resistance and trends. For several years, the model has beaten the index many times over, when combined with the weekly trend.
This is a long-term management model that increases the chances of getting rich in the long term. Feel free to browse several stocks with the model and you will probably think “I should have done that”. It is not an optimal model, but it works in practice. Works on any time series with sufficient data. Shares, funds, ETFs, indices…
How to use the model?
This is what I did when the stock market went up 6% and the BEST model made 85% in 2020. Fourteen times better than the index! All Nordic and US stocks were filtered using the BEST model.
- The condition was that shares would be in buy mode for all daily-weekly-monthly graphs. An autopilot did the job, but it is possible to filter yourself by running a signal table on day, saving those with buy signal in an item list, continuing with weekly data for the selected stocks, saving results in a new item list and running one last time with BEST and monthly data. A signal table for several shares is called a collection table in Viking.
2. Remove the shares that are close to a resistance. Those stocks are likely to stall in their rise. Also carried out a fundamental assessment of the key figures. Turnover may increase, P/S ratio below 4, P/B ratio below 3, low P/E ratio, debt ratio below 1.
3. Prioritize the stocks that have a positive trend in the monthly chart. This increases the chance that the stock will go up in the long run.
4. I built a portfolio of 15 stocks. Some were replaced when they received a sell signal.
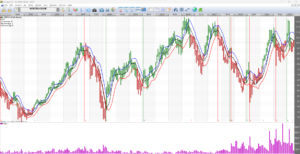
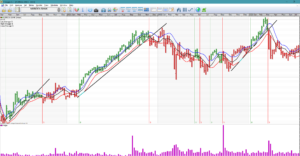
5. Shares are sold when the weekly trend is broken. Simple but effective method. Draw a line under the bottoms of the rising trend.
6. After a share has been sold, the steps above are repeated. ATTENTION! It’s NOT a buy signal every day and you shouldn’t buy!
What is included in the model ?
The model consists of several models, a so-called multi-model. Important elements are Volatility signal, RSI, average of lowest prices, average of highest prices and gap.
When prices start to diverge much more than they usually do, it is usually a good signal for further movement in that direction. The strength of the stock, as measured by the Relative Strength Index, confirms the direction of movement. We also know that various band models are good at removing unnecessary buy and sell signals, as are averaging models. If there is a strong breakout to the upside, like a gap up, it confirms the buy signal. A sudden momentum up or down also reinforces the signal.
An optimization with MONTHLY DATA gave the following approximate optimal settings:
Number of volatility periods = 4, RSI length=5, RSI average=5, Number of periods for average of lowest prices=7, Number of periods for average of highest prices=5, Number of periods for average of last paid=6, Buy percentage weight=2.5, Sell percentage weight=1.1, Buy signal multiplier=0.26, Sell signal multiplier=2.92