Post No. 2 on how AI is changing the rules of the game in stock trading!


Whether you use ChatGPT (below CG) or another AI service, or Vikingen (V), the key is being able to analyze and perform calculations on historical price data (facts). In both cases, very large amounts of data are available.

If you ask CG to perform a “technical analysis” via a prompt, the problem is that you don’t quite know what models and distribution spaces are involved or what data is being used. The more detailed and specific the prompt is, the better the AI can provide relevant and accurate responses. So the prompt may need to be reworded and clarified. Several experts use the answer from one AI service and feed it into another one.

If you ask CG via a prompt to “Evaluate the Ray B stock using technical analysis and determine whether it is a buy,” CG will provide an assessment stating “that the stock is a buy with positive medium-term potential.”
Here’s a short video showing you how it’s possible to use ChatGPT for technical analysis.

Technical Analysis of the Ray B Stock by ChatGPT
Trend: Buy. The stock is trading above both the 50-day and 200-day moving averages, indicating an established uptrend.
Momentum: Positive. The stock has risen significantly over the past 3 months, which supports continued strength.
RSI: Appears to be in the upper part of the neutral zone. Not clearly overbought yet, but the stock should be monitored if the rally continues.
MACD: Continues to indicate positive momentum, according to the latest technical signals.
Support/Resistance:
Around 220 to 225 SEK.
The next resistance level is around 240 to 250 SEK, followed by higher levels approaching previous peaks.
Once again, this comes down to the same issue as above: the more detailed and specific the prompt is, the better the CG can provide relevant and accurate answers. So the prompt may need to be reworded to include which models should be used, how those models should be configured, and so on. In a moment, we’ll analyze the Ray B stock by using Vikingen Financial Software.

If you ask CG, using a prompt to “rank Ray B relative to previous montitored stocks,” it returns with this conclusion:
RaySearch is technically in a buying zone, but it’s a step below the strongest trending stocks like Saab, Sandvik, and Volvo. Ray B is most interesting if it continues to stay above its 50-day moving average and breaks through the nearest resistance level with rising volume.
Once again, the task comes down to the same issue as above: the more detailed and specific the prompt is, the better the AI can provide relevant and accurate answers. So the prompt may need to be reworded and include a table comparing the model values for the stocks in question.
“What goes around comes around.” By this I mean that you need to be very experienced and know quite a bit about technical analysis to be able to formulate detailed and precise prompts; otherwise, you risk getting imprecise answers. Conversely, I have no doubt that prompts can be formulated and that ChatGPT is a powerful tool of the future.

Below, we ask Vikingen the same questions
If you ask Vikingen about “technical analysis,” a blank screen appears.
Before you can proceed, you must:
A. Select the securities (stocks, funds, investment certificates, etc.) you want to analyze. For example, we could create a small group of stocks consisting of Ray B, Saab, Sandvik, and Volvo.
B. Select the models you want to be used in the analysis (there are over 40 models to choose from in Vikingen, among them the proprietary, well-known BEST-Model)
If you ask Vikingen to evaluate the Ray B stock using technical analysis, my model choices and settings will produce the screenshot below. It may seem overwhelming, but let’s walk through the screenshot.
You can see three columns: weekly data on the far left, monthly data in the middle, and annual data on the far right.
Under “Annual Data” (diagram at the bottom), you can see how the stock has moved around its (blue-dotted) “DNA strand.” In early 2022, it hit a low, from which it rose until mid-2025 before falling again.
Under “Annual Data” (diagram at the top), you can see the speed (momentum).
Below the monthly data (diagram at the bottom), you can see a blue line indicating the RSI (approx. 30).
The mRudolph model shows that the stock has been in a downtrend since August 2025.
Under the monthly data (diagram in the middle), you can see the Bollinger Band model that shows essentially the same result.
Under the monthly data (diagram at the top), you can see the momentum
In the weekly data column, the bottom two models are the same as the ones in the middle, but with weekly data. The second chart from the top shows the trend, which indicates an ascending trend channel; however, the stock is trading below its 120-day (24-week) moving average and is therefore in a bear market.
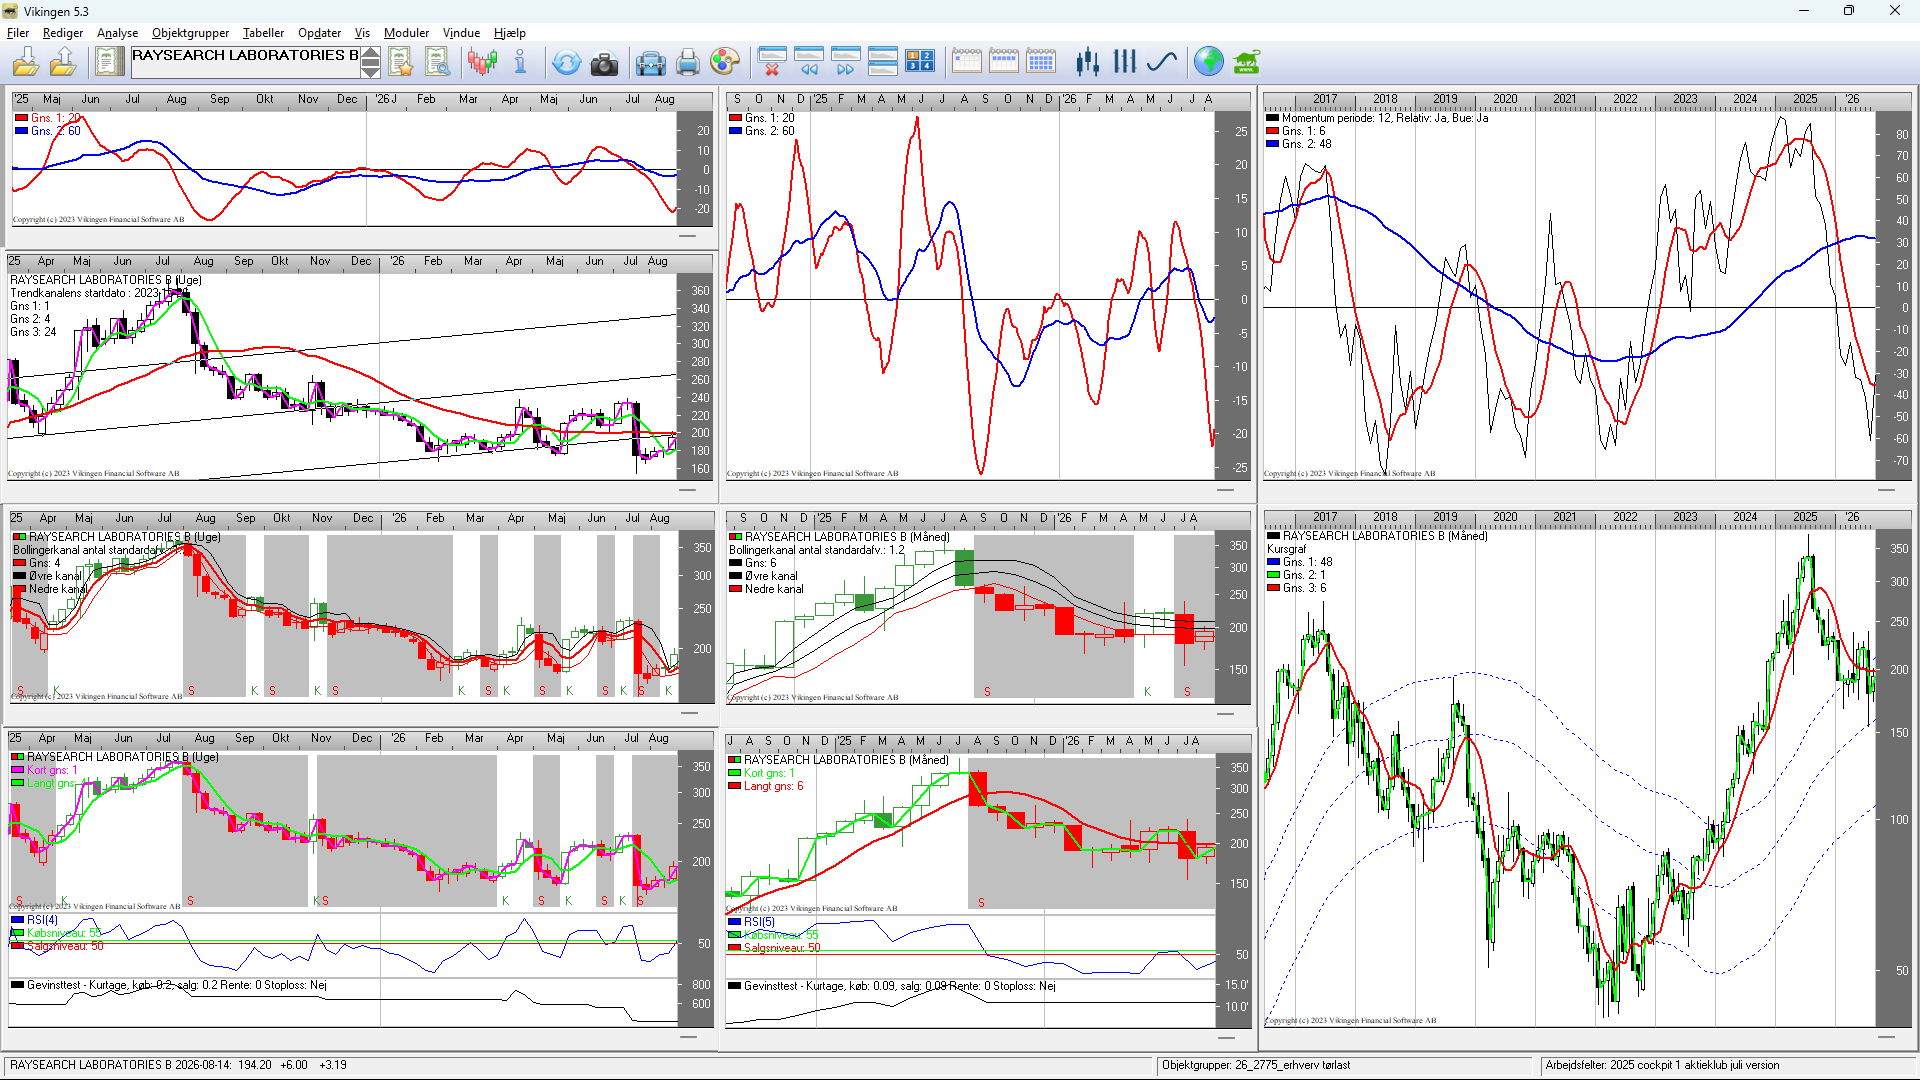
Now let’s try putting them together: Vikingen’s diagrams of Ray B with ChatGPT’s prompt response and technical assessment.
If you ask Vikingen to rank Ray B relative to Saab, Sandvik, and Volvo, you can use Vikingen’s Autopilot to create the table in Excel; see below.

In Denmark, we have the Vikingen Network, where we analyze approximately 175 major Nordic stocks on a weekly basis. Below, I show a list of candidates that I receive with just a few clicks in Vikingen.
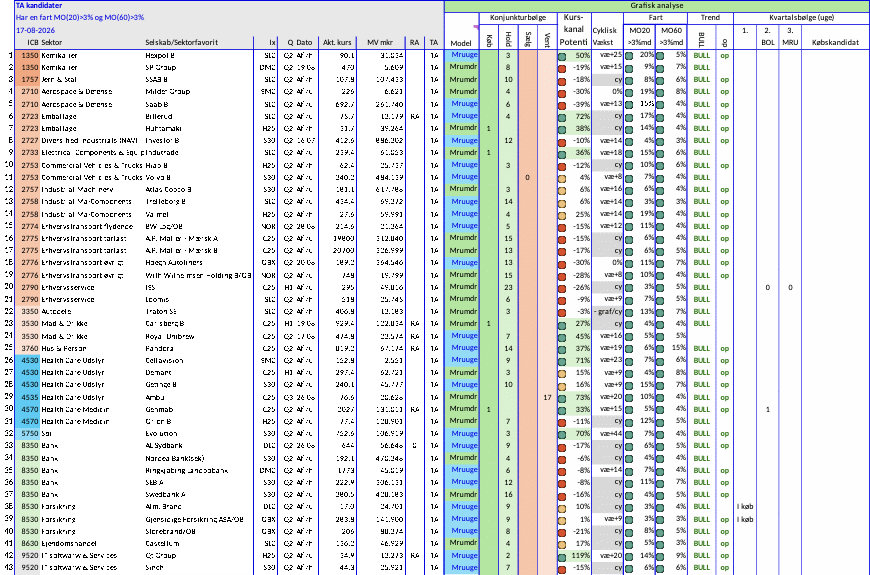
If you live in Denmark, you are welcome to join the Vikingen network and take advantage of Uffe Raahede’s long experience and expertise!
Vikingen Financial Software would like to remind you that past positive results do not always indicate future profits, and that all trading is done at your own risk.

Vikingstocktips.com – AI-based buy and sell signals based on 40 years of experience with Vikingen Financial Software!
Vikingstocktips.com – Launching in the fall of 2026!
Every week, Vikingstocktips runs approximately 70 million simulations based on historical stock data using Vikingen Financial Software’s proven signal models. Each stock is continuously optimized, and the settings are updated as soon as a new simulation shows a better historical return.
By analyzing millions of historical price patterns, Vikingstocktips.com identifies the settings that have consistently yielded the most reliable results. The models that demonstrate the strongest historical returns are given greater weight, which helps improve the quality of future buy and sell signals.
Stay tuned for more information on when we’ll launch this powerful tool, so you, too, can benefit from AI-generated buy and sell signals, 40 years of experience, and ongoing analysis!
Vikingen Financial Software reminds you that past performance is not always indicative of future profits, and that all trading is at your own risk.
Sincerely,