Who are the gold nations of the world?
The global gold market has made an impressive recovery after two years of consecutive declines from the COVID-19 pandemic. Currently, gold mining and investment has an estimated market value of $13.2 trillion, which is good news for some of the top gold-producing countries in the world, known as gold nations.
In this article, we look at the World Gold Council’s data on central bank gold reserves and consumer demand for jewelry, ETF holdings and per capita demand at the international level. Examining these finds will reveal the countries with the most valuable gold reserves.
As more and more experts and consumers continue to worry about a potential recession and an uncertain economic future, many are looking for ways to protect themselves and their savings. As you live in today’s changing world and changing economy, you may be looking at your finances and investment plan. Investing in gold is a smart choice and can help provide stability in times of uncertainty. It is an excellent opportunity to protect your financial future, as well as to diversify your investment portfolio.
The 10 biggest gold nations in the world
| Rank | Country | Central bank reserves Gold (tons) | Gold reserves
(millions) |
ETF Gold holdings (tons) | ETF Gold demand (tons) | Consumer demand per capita (grams) |
| 1 | USA | 8,133 | 517,689 | 1,668 | 10.5 | 0.75 |
| 2 | Germany | 3,355 | 213,536 | 401 | -12.4 | 2.34 |
| 3 | Switzerland | 1,040 | 60,646 | 341 | -11.2 | 5.58 |
| 4 | Turkey | 572 | 36,406 | 5 | 3.6 | 1.43 |
| 5 | Italy | 2,452 | 156,058 | 8 | 2 | 0.33 |
| 6 | China | 2,068 | 131,650 | 51 | -0.8 | 0.56 |
| 7 | Saudi Arabia | 323 | 18,839 | 0 | 0 | 1.44 |
| 8 | Japan | 846 | 53,846 | 26 | 0.9 | 0.03 |
| 9 | Canada | 0 | 0 | 70 | -0.1 | 0.71 |
| 10 | France | 2,437 | 155,102 | 69 | -2.5 | 0.30 |
The US is the largest gold nation in the world
USA
The USA is the number one gold nation in the world, scoring 8.93 out of 10 in the ranking of 17 selected countries. The United States had the highest volume of central bank gold reserves (8,133 tons) and ETF gold holdings (1,668 tons).
Investopedia defines ETFs as “baskets of stocks or bonds that are traded like regular stocks” that are “usually managed passively, meaning they only try to match the underlying benchmark.” The largest gold exchange-traded fund is the SPDR Gold Trust, which is the best choice for investors looking to manage the precious metal.
Consumer demand for gold in the US is growing rapidly, and CNBC has reported that demand for bars and coins has strengthened by 5% year-on-year to 302 tons. There was a shift in key markets in March, with US demand reaching its highest quarterly level since 2010.
Germany
Germany ranked second among the largest gold-producing countries, with a score of 6.83 out of 10. Germany fell just behind the US in terms of its volume of central bank gold reserves (3,355 tons) but recorded higher consumer demand (2.34 grams). The diversity of demand in the gold market underpins the robustness of gold as an investment asset.
Germany also has the third largest volume of ETF gold holdings (401 tons) after the US and the UK. In addition, Investopedia reported that Germany consumed 5.4 tons of gold in the fourth quarter of 2019, and as of 2021 it is the fifth largest consumer in Europe, after Turkey.
Switzerland
The mountainous country of Switzerland took third place in the competition for the most outstanding gold nations, with a score of 6.57 out of 10. Switzerland is a rich country with a GDP per capita well above $80,000, so it correlates that the Swiss would also consume a lot of gold. As a major financial hub, Switzerland has among the highest ETF gold holdings (341 tons) as of the first quarter of 2023, and also had the highest consumer demand per capita (5.58 grams) compared to any other country, including the United States.
According to Swissinfo.ch, Switzerland is the largest global importer of gold, buying CHF 90 billion (USD 92.3 billion) of the metal in 2021. Although the country has less gold reserves (60 646 million) than the US and Germany, it is still the world’s largest hub for refining and transit of precious metals. In February, Reuters reported that Switzerland sent 58.3 tons of gold worth $3.6 billion to Turkey in January, which is by far the most for a month, in a record that dates back to 2012.
China is the largest gold mining country in the world
Below is a summary of the nine largest gold producers in the world, as of 2022.
| Country | Gold production (tons) |
| China | 330 |
| Australia | 320 |
| Russia | 320 |
| Canada | 220 |
| USA | 170 |
| Kazakhstan | 120 |
| Mexico | 120 |
| South Africa | 110 |
| Peru | 100 |
| Uzbekistan | 100 |
Gold mining in China has made the country the world’s largest producer of the precious metal. As of 2022, it was estimated by the World Gold Council that China’s mining industry produced over 330 tons of gold.
In 2007, gold production increased by 12 percent from 2006 to 276 tons, and China became the world’s largest producer for the first time, overtaking South Africa, which had been the largest for a continuous 101 years since 1905.
Two countries are tied for the second largest producers of gold in 2022, with both Russia and Australia producing 320 tons of gold.
Demand for gold in Egypt increases by 55%, the highest in the world
Countries with the highest change in consumer demand for gold in 2022.
| Country | Increased demand |
| Egypt | 55 % |
| Iran | 38 % |
| Vietnam | 37 % |
| UEA | 33 % |
| Singapore | 31 % |
| Russia | 30 % |
| Turkey | 28 % |
| Malaysia | 25 % |
| Australia | 18 % |
| France | 17 % |
Egypt
Egypt experienced the highest increase in demand for gold, with a 55% increase compared to the previous year. Demand in the country stood at 34.1 tons in 2021 before rising to 52.7 tons in 2022. As the Egyptian pound hit record lows and inflation accelerated, Egyptians turned to gold to avoid uncertainty about the local currency. It was reported that gold bars and coins accounted for the bulk of the purchases.
Iran
Iran had the second highest increase in its consumer demand for gold, with an annual increase of 38%. As Iran continues to struggle with an uncertain economic future, people are trying to ensure that the value of their savings is not eroded by inflation. Over the past four decades, it has been reported that Iranians have increased their faith and trust in gold as a method of reducing the risk to their savings, demonstrating the ongoing demand for the precious metal among consumer markets.
Vietnam
Vietnam took third place with a 37% increase in consumer demand for gold. Andrew Naylor, the regional CEO of the World Gold Council, reported that due to the pandemic, many Vietnamese customers were cautious about making high-value purchases. Nevertheless, sales increased at the end of 2022. Vietnam’s strong recovery from the pandemic and its ability to manage the situation helped boost consumer confidence, leading to an impressive increase in annual gold demand.
| Country | 2021 | 2022 | Y/Y change |
| Egypt | 34,1 | 52,7 | 55 % |
| Iran | 51,8 | 71,7 | 38 % |
| Vietnam | 43,0 | 59,1 | 37 % |
| UEA | 41,6 | 55,3 | 33 % |
| Singapore | 11,5 | 15,0 | 31 % |
| Russia | 46,8 | 60,7 | 30 % |
| Turkey | 95,3 | 121,7 | 28 % |
| Malaysia | 14,9 | 18,5 | 25 % |
| Australia | 31,0 | 36,4 | 18 % |
| France | 17,0 | 20,0 | 17 % |
Egypt’s demand for gold bars and coins has increased by 693% in one year
The table below shows the increased demand for gold bars and coins in 2022 compared to 2021.
| Country | Increased demand |
| Egypt | 693 % |
| Russia | 374 % |
| Iran | 64 % |
| Turkey | 38 % |
| Singapore | 32 % |
| Vietnam | 32 % |
| Malaysia | 27 % |
| France | 25 % |
| Austria | 16 % |
| Kuwait | 16 % |
Egypt
Egypt also held the title for the highest increase in demand for gold bars and coins, with a huge growth of 693% between 2021 and 2022. Arab Finance reported that Egyptian purchases of gold coins and bars increased by 83% in 2022 to 4.4 tons.
Russia
Russia ranked second with a 374% growth rate in demand for gold bars and coins. The World Gold Council reported that demand for gold bars and coins grew faster in Russia in 2022 than in any other country, rising to almost five times the level in 2021. In March, the central bank restricted the sale of foreign currency, and on the same day Vladimir Putin scrapped VAT on the purchase of gold bars, triggering an increase in purchases.
Iran
Iran came third with a 64% year-on-year growth rate, rising from 25.5 tons of gold bars and coins in 2021 to 41.8 in 2022. As the country’s consumer demand grew, increased investment in gold bars and coins was stimulated by a weak domestic currency, resulting in sky-high gold prices.
| Country | 2021 | 2022 | Y/y change |
| Egypt | 2,4 | 19,2 | 693 % |
| Russia | 5,3 | 25,0 | 374 % |
| Iran | 25,5 | 41,8 | 64 % |
| Turkey | 61,4 | 84,8 | 38 % |
| Singapore | 4,5 | 5,9 | 32 % |
| Vietnam | 31,1 | 41,0 | 32 % |
| Malaysia | 4,4 | 5,5 | 27 % |
| France | 4,7 | 5,8 | 25 % |
| Austria | 12,2 | 14,2 | 16 % |
| Kuwait | 3,6 | 4,2 | 16 % |
Vietnam had the highest demand for jewelry in the world, with an increase of 51% year-on-year.
| Country | Increased demand |
| Vietnam | 51 % |
| UAE | 38 % |
| Australia | 30 % |
| Singapore | 30 % |
| Malaysia | 24 % |
| Taiwan | 19 % |
| Thailand | 17 % |
| France | 14 % |
| Saudi Arabia | 14 % |
| Italy | 14 % |
Vietnam
In addition to ranking in the top three countries for its increased demand for gold in general, Vietnam has the highest demand for gold in the world, with a 51% increase between 2021 and 2022. According to the World Gold Council, in Ho Minh City, the production of jewelry is estimated at 2,500 products per year. Since 2005, the demand for gold in Vietnam has grown rapidly.
United Arab Emirates
In second place is the wealthy Middle Eastern country of the United Arab Emirates. The UAE witnessed a 38% increase in jewelry demand, from 33.8 tons in 2021 to 46.9 tons in 2022. In 2022, it was reported that rising oil prices increased sentiment among gold consumers in the Middle East. The second quarter saw an increase in jewelry purchases for the wedding and festival season among Indian customers, who make up a large part of the expatriate population in the UAE.
Australia
In third place is Australia, which also made it to the top five in this index for its gold mine production. Australia experienced a 30% increase in jewelry demand between 2021 and 2022. According to the WGC, the 30 percent growth in Australia’s annual jewelry demand was partly due to the base effects of the strict covid restrictions at the time. Nevertheless, annual demand was good. The jewelry segment in Australia is expected to grow by 4.63% between 2023 and 2026.
Turkish lira gold price has risen 142% in three years
| Currency | Price change |
| Turkish lira (TRY) | 142,01 % |
| Egyptian pound (EGP) | 51,22 % |
| Japanese yen (JPY) | 22,80 % |
| Korean won (KRW) | 11,85 % |
| South African rand (ZAR) | 11,31 % |
| Thai bath (THB) | 11,08 % |
| Euro (EUR) | 10,16 % |
| Australian dollars | 9,34 % |
| GBP | 9,19 % |
Turkish lira
The Turkish lira saw a 142.01% increase in its gold value, rising from ₺14,029 to ₺33,952 per troy ounce. Many people in Turkey are turning to gold as a way to protect their savings against the lira, which has fallen by 60% against the US dollar, a record low.
Egyptian pound
The Egyptian pound had the second highest increase in its gold value at 51.22%. This month, a new import scheme in Egypt was approved by the government that allows incoming travelers to bring in unlimited gold for the next six months, while only paying a value-added tax on it upon arrival. Before that, travelers to the country were banned from bringing in gold bars. The aim of the program is to increase the supply of gold on the local market to bring down prices.
Japanese yen
The Japanese yen ranked third with a 22.80% increase in the value of gold. The precious metal peaked at 239,315 yen per troy ounce in 2022, which was higher than the previous record of 207,952 yen.
| Currency | Price change |
| Turkish lira (TRY) | 142,01 % |
| Egyptian pound (EGP) | 51,22 % |
| Japanese yen (JPY) | 22,80 % |
| Korean won (KRW) | 11,85 % |
| South African rand (ZAR) | 11,31 % |
| Thai bath (THB) | 11,08 % |
| Euro (EUR) | 10,16 % |
| Australian dollars | 9,34 % |
| GBP | 9,19 % |
Methodology
Central bank gold reserves by country were taken from the Gold Hub for the first quarter of 2023 (March 31, 2023).
The following data was collected for 2022:
The Gold ETF holdings per country were taken from the Gold Hub’s Gold ETF holdings and flows.
Jewelry, bars and coins, consumer demand and per capita demand for each country were taken from the Gold Hub’s Historical Demand and Supply.
Gold mine production volumes by country were taken from the US Department of the Interior’s MINERAL COMMODITY SUMMARY 2023.
The value of gold in each currency over the last three years was taken from Gold Hub gold spot prices.
Gold price
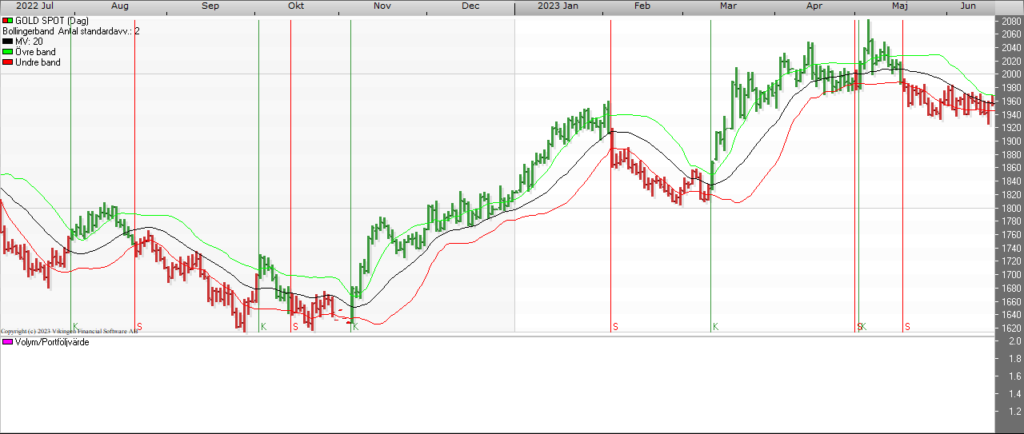
Source: Vikingen.se
About the Viking
With Viking’s signals, you have a good chance of finding the winners and selling in time. There are many securities. With Viking’s autopilots, price data, tables and stock prices, you can sort out the most interesting ETFs, shares, options, warrants, funds, etc.
Click here to see what Vikingen offers: Detailed comparison – Stock market program for those who want to become even richer (vikingen.se)