The five selected technology stocks from the US

Five selected tech stocks from the US
The five selected tech stocks from the US described in the article Goldman Sachs likes these five tech stocks are Arista Networks, Arm Holdings, Monday.com, AppLovin and ASML Holding. Here we will look at the timing of buying or selling them from a technical perspective.
Arista Networks is one of the selected stocks
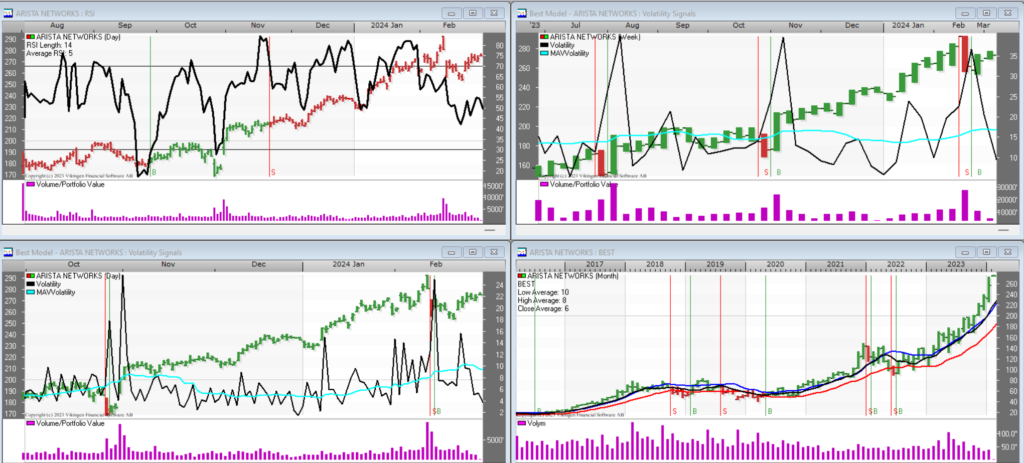
At the top right, we can see in the weekly chart that the stock has had a strong trend reversal. Which suggests that the stock has done its job for this time. This is supported by the fact that volatility in the same chart reached an unusually high level and turned downwards. The price is likely to remain stagnant in the near future or go down due to profit-taking.
An optimization in Viking Maxi resulted in the Voatility model being a good fit for Arista Networks for daily and weekly data. BEST fits monthly data. With daily data, it has historically yielded about 29% per year. Good settings are the 17-day volatility with an upper limit of 2.5 for sell and 0.5 for buy. The next sell signal will be if the stock goes down another 9%, approximately at 249 USD according to optimized settings and tomorrow’s signals.
The next stock selected is Arm Holdings
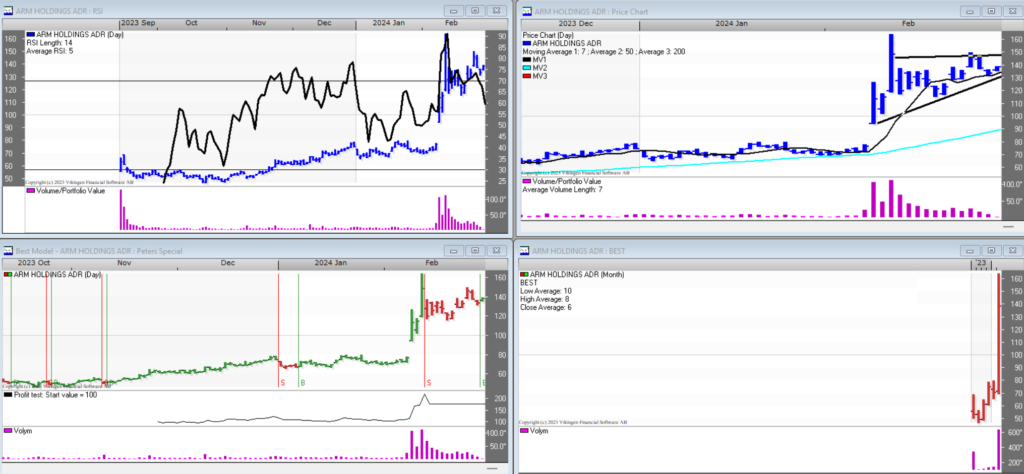
The stock is in an ascending triangle on the daily chart. The forecast is that the stock will continue to rise through resistance. The distance between the high and low of the triangle is USD 50 and therefore the forecast is that the stock will go up from USD 150 to USD 200.
Because the stock is so new, there is not enough data to find the best model for monthly and weekly data. For daily data, Peter’s specialists seem to be the best. A model I made a long time ago, intended for day trading. That model has currently given a buy signal. Optimized settings: Backward periods to compare with: 6, RSI: 6, RSI average: 5, Buy signal multiplier: 0.3, Sell signal multiplier: 1.3.
The next sell signal comes if the stock goes down, at USD 126, about 9%.
Among the five selected stocks from the US, Arm Holdings looks particularly good, especially now that it has a buy signal.
The third selected stock is Monday.com.
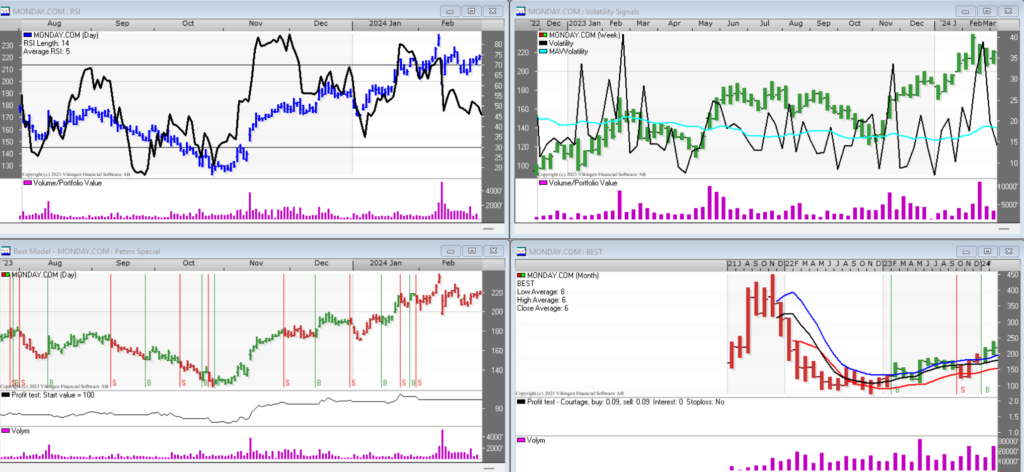
The stock is stationary, it has no signals at all. This is the usual condition for stocks, they usually have no signal at all. It is probably best to wait and see.
For daily data it is optimal to use the model Petersspecialare with the settings: Backward periods to compare with: 6, RSI: 10, RSI average: 7, Buy signal multiplier: 0.3, Sell signal multiplier: 0.3. For weekly and monthly data, there is too little data.
Do we love the featured stock AppLovin?
In the long term, it looks like a good placement.
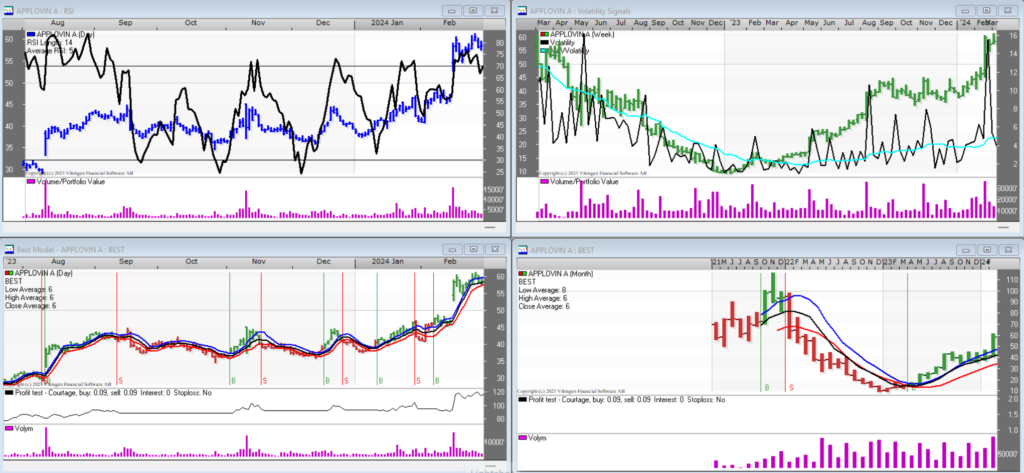
In the monthly chart at the bottom right with the BEST model, you can see that turnover has increased significantly and the price has broken through its resistance. The stock has only just begun its upward journey. This stock also looks very interesting among the five selected technology stocks from the US.
The best model according to daily data for AppLovin is the BEST model. If the stock goes down about 2.4 percent, it becomes a short term sell signal at USD 57.
In the daily chart at the bottom left, you can see a flag formation. Because it comes from below, the rush tends to continue upwards. The rule of thumb is that there are three stops on the way up. This is the first one.
Is ASML Holding the best stock among the selected ones?
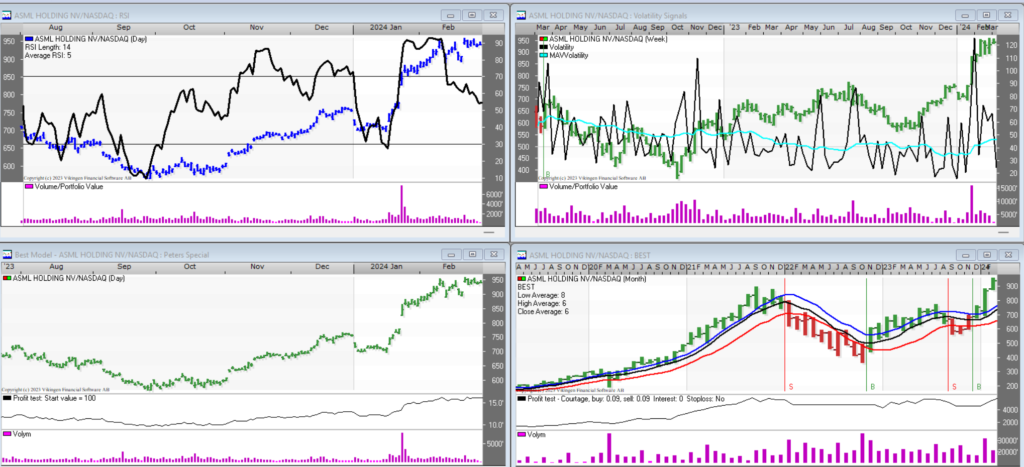
In January, the stock broke up through the resistance in the monthly chart to the lower right with good force. Since then, the stock has continued to rise, albeit with less turnover. The RSI is also falling, suggesting that the stock will remain stagnant in the near future.
According to the Peters specialist model, the next sell signal is at USD 840 when the stock has fallen 11%. However, it is a short-term signal with daily data. The monthly chart shows that the previous peak was at USD 896 and the stock now stands at around USD 945. The previous peak represents a support to which the price can fall back and therefore it seems that the risk in the stock is quite low.
Read more about the selected shares here:
Which of the five selected stocks from the US did you think was the best?
Goldman Sachs likes these five tech stocks
About the Viking
With Viking’s signals, you have a good chance of finding the winners and selling in time. There are many securities. With Viking’s autopilots or tables, you can sort out the most interesting ETFs, stocks, options, warrants, funds, and so on. Vikingen is one of Sweden’s oldest equity research programs.
Click here to see what Vikingen offers: Detailed comparison – Stock market program for those who want to get even richer (vikingen.se)
Disclaimer
Historical prices are no guarantee that the price will continue in a certain direction. The tips in this post are up to you to follow or not, and are entirely up to your own risk or chance.
Future price developments have two main components: trend and chaos. Trend we can predict and calculate, but not chaos.