Swing trading, what is the difference with day trading?

Swing trading is a type of trading strategy that mainly focuses on making profits through trend changes over short time frames. Positions are held for a few days to weeks if trading remains profitable.
Swing trading and day trading may appear to be the same thing, but there are major differences between these two trading strategies. In this type of trading strategy, a trader makes money by following the price movement in a specific direction.
When learning about the technical basics, you must have come across the term “Trade with the trend”. That’s exactly what Swing Trading means, trading with a trend. It is a strategy that focuses on getting smaller profits in short-term trends. The profits may be smaller, but .one can consistently work with this, it can give a good annual return over time.
Swing Trading positions are held for a few days to a couple of weeks, but it can also be held longer. Let’s go into this in detail, the difference between day trading and swing trading and also swing trading strategies:
What is Swing Trading?
Swing trading is a type of trading strategy that mainly focuses on making profits through trend changes over short time frames. Here, positions are held for a few days to weeks if the trade remains profitable.
Swing traders can find many trading opportunities by using various technical indicators to identify patterns, the direction of the trend and also potential short-term trend changes.
Day trading vs Swing trading:
Swing trading and day trading may seem the same, but there are major differences between these two trading strategies. First, the timeframes for trade are different. Day traders usually close their trades within minutes or hours while swing traders hold their positions for days or weeks.
Second, day trading involves constant attention to the market as day traders constantly search for new trading opportunities throughout the day. Whereas swing traders have a few transactions every few days so that they can regularly monitor their trades.
Third, day trading is usually done by analyzing price action and technical indicators while swing trading can be done using both technical and fundamental analysis.
Swing trading trading strategies
In this type of trading strategy, a trader makes money by following the price movement in a specific direction.
Before going to the strategies, you should understand the following terms:
Entry point: It is the point at which traders enter their trading position which can be determined by technical indicators.
Exit point: It is the point at which traders close their trading position which can also be determined by technical indicators.
Stop loss: Placing a stop loss is very important as it helps a forex trader to incur less losses.
Now let’s discuss various technical indicators that can be used to enter or exit swing trades:
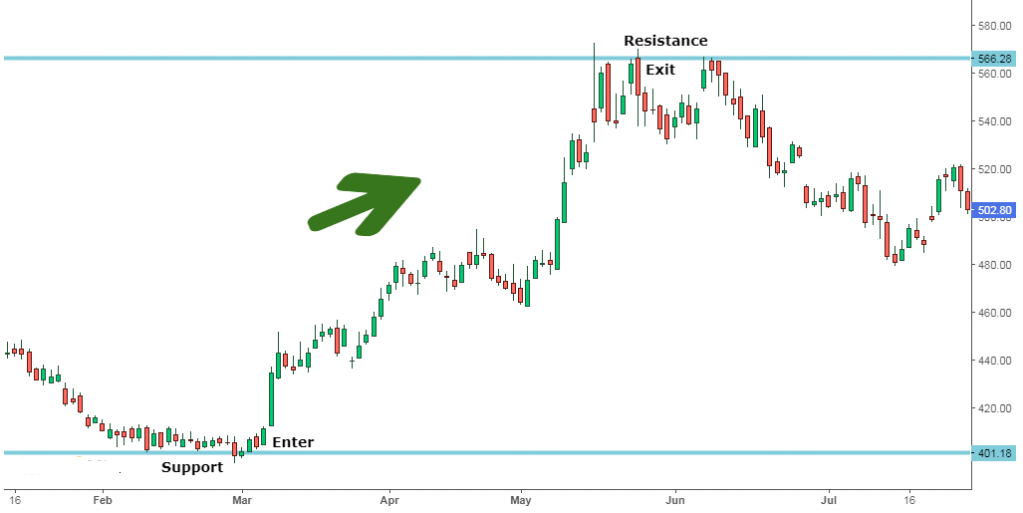
Support and resistance
Support is the zone where there is enough buying pressure to make prices bounce back in an upward direction and it results in a return from a downward to an upward trend.
 Moving average, Moving Average
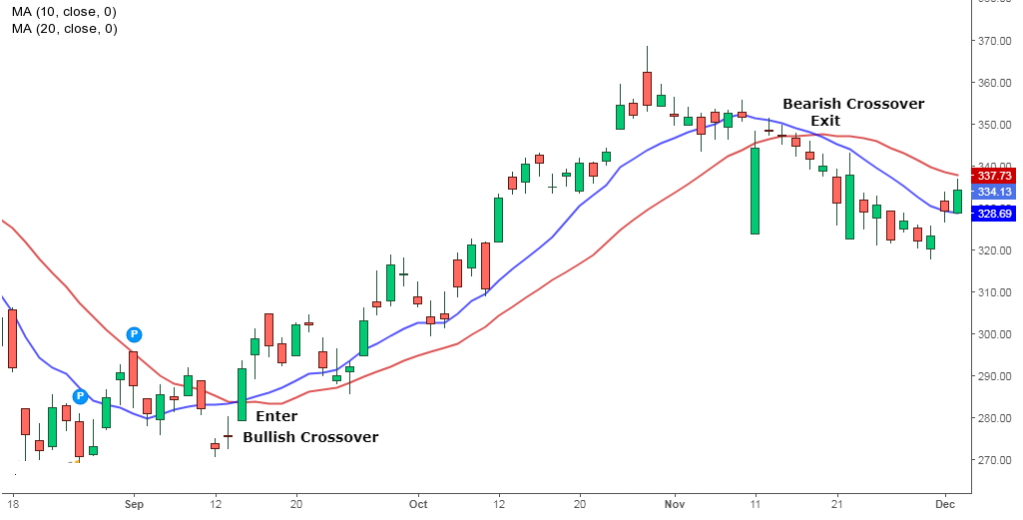
Swing Traders can use the Simple Moving Average (SMA) 10 and (SMA) 20 to find entry and exit points for their swing trading.
When the SMA 10 crosses the SMA 20 from below, there is a bullish crossover and when the simple moving average 10 crosses the SMA 20 from above, there is bearish crossover.
When there is a bullish crossover, a swing trader can enter a buy position and when there is a bearish crossover traders can exit the position as shown in the below chart.
 MACD Crossovers
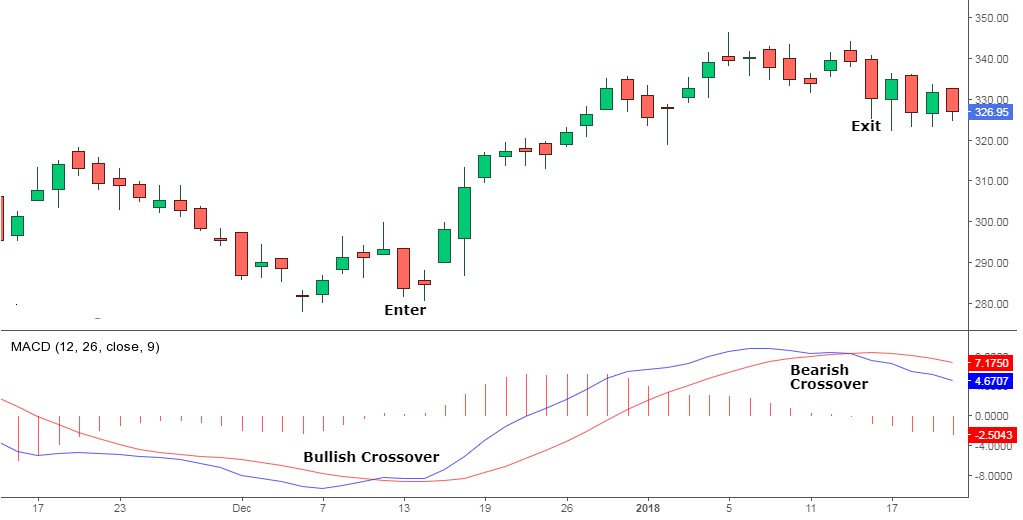
MACD Crossovers are one of the most popular indicators used to determine the trend direction and reversals. The MACD consists of two moving averages, the MACD line and the signal line. The buy and sell signals are generated when these two lines cross each other.
When the MACD falls below the signal line, it is a bearish signal indicating that it may be time to sell. Similarly, when the MACD rises above the signal line, the indicator gives a bullish signal, suggesting that the asset’s price is likely to experience upward momentum. Here is the example of MACD bullish and bearish crossovers:
 Bollinger Bands
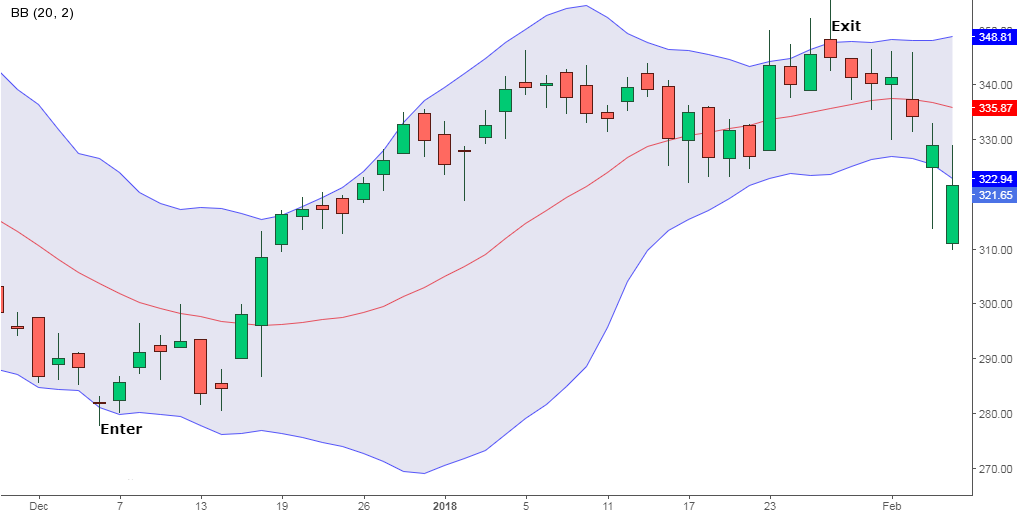
Swing trading using Bollinger bands is one of the most popular techniques. One can use this indicator to find out about swing trading in the following ways:
One should wait for prices to touch the lower band, but Candlesticks can also be analyzed to enter the buy position when they touch the lower band. Further trend confirmation is made when prices cross the middle band. Exit your position when prices touch the upper band and reverse into a downward trend. Below is the example to help you understand the above points.
 Fibonacci retracement
The Fibonacci retracement pattern can also be used to identify support and resistance levels as well as reversal levels. Fibonacci ratios such as 23.6%, 38.2% and 61.8% can be used as the potential reversal levels.
A Swingtrader can enter a sell position if the price in a downtrend retraces to and bounces off the 61.8% retracement level which acts as a resistance level. They can exit the sell position when the price goes down and bounces off the 23.6% Fibonacci line which acts as a support level.
In addition to these technical analysis indicators discussed above, one should also be familiar with basic fundamental analysis. Remember to place stop loss in your swing trading as it will help you cut your losses if the trade does not go as planned.