Similarities and differences between RSI and Stochastics as a buy signal
We were asked:“What is the difference between RSI and Stochastic? In this post we will go through the two well-known indicators in technical analysis, which are often used as buy or sell signals in trading. For the RSI, the 30 level on daily charts is often set as the oversold limit, indicating that it is time to buy the stock, commodity or currency pair. If the RSI shows above 70, it can be a common way to go short with CFDs. Join us to learn how Stochastics works and whether it can be an alternative to RSI – and learn how both work. Ultimately, you only need a trading site like Skilling to get started and test which of the technical indicators you prefer.
The relative strength index (RSI) and stochastic oscillator are both price momentum oscillators used to predict market developments. Despite their similar objectives, the two indicators have very different underlying theories and methods. The stochastic oscillator is based on the assumption that closing prices should close in the same direction as the current trend. RSI tracks overbought and oversold levels by measuring the speed of price movements. More analysts use the RSI over the stochastic oscillator, but both are well-known and reputable technical indicators.
Relative strength index (RSI)
J. Welles Wilder Jr. developed the relative strength index by comparing recent gains in a market with recent losses. In this way, RSI is a momentum indicator that measures the size of recent price changes to evaluate overbought or oversold conditions in the price of a stock or other asset.
RSI usually appears as an oscillator (a line graph moving between two extremes) at the bottom of a chart and can have a reading from 0 to 100. The center of the line is 50. When the RSI moves above 70, the underlying asset is considered overbought. Conversely, the asset is considered oversold when the RSI reads below 30. Traders also use RSI to identify areas of support and resistance, detect anomalies for possible reversals and to confirm the signals from other indicators.
Stochastic oscillators
George Lane created stochastic oscillators that compare the closing price of a security with a range of its prices over a given period of time. Lane believed that prices tend to close near their peaks in up markets and near their lows in down markets. Like the RSI, stochastic values are plotted in the range between 0 and 100. Overbought conditions exist when the oscillator is above 80, assets are considered oversold when values are below 20.
The stochastic oscillator chart generally consists of two lines: one reflecting the actual value of the oscillator for each session and one reflecting its three-day simple moving average. Since price is believed to follow momentum, the intersection of these two lines is considered a signal that a reversal may be underway, as it indicates a large change in momentum from one day to the next.
Differences between the stochastic oscillator and trending price measures are also seen as an important reversal signal. For example, when a bearish trend reaches a new lower low, but the oscillator prints a higher low, it could be an indicator that bears are exhausting their momentum and a bullish reversal is breaking. Similarly, differences between RSI and price are also considered significant.
Similarities between RSI and Stochastics
They seem similar, but StochRSI RSI and Stochastics rely on a different formula than what generates RSI values. RSI is a derivative of price. Meanwhile, StochRSI is the derivative of RSI itself, or a second derivative of price. One of the main differences is the speed at which the indicators move. The StochRSI moves very quickly from overbought to oversold, or vice versa, while the RSI is a much slower moving indicator. One is not better than the other, the StochRSI just moves more (and faster) than the RSI.
A disadvantage of using the StochRSI is that it tends to be quite volatile and goes from high to low quickly. Smoothing the StochRSI can help in this regard. Some traders take a moving average of the StochRSI to reduce volatility and make the indicator more useful. For example, a 10-day simple moving average of the StochRSI can produce an indicator that is much smoother and more stable. Most platforms make it possible to apply one type of indicator to another without any personal calculations.
The StochRSI is also the second derivative of the price. In other words, its output is two steps away from the actual price of the asset being analyzed, which sometimes means it can be out of sync with an asset’s real-time market price.
What is the difference between Stochastics and the 14-day RSI?
Stochastics follow the trend and expect the trend to go in the same direction all the time. RSI measures overbought or oversold, by measuring the speed/tempo (please elaborate).
Both the relative strength index (RSI) and stochastic oscillator are price momentum oscillators used to predict market developments. Despite their similar objectives, they have very different underlying theories and methods. The stochastic oscillator is based on the assumption that closing prices should close in the same direction as the current trend. RSI tracks overbought and oversold levels by measuring the speed of price movements. More analysts use the RSI over the stochastic oscillator, but both are well-known and reputable technical indicators.
J. Welles Wilder Jr. developed RSI by comparing recent gains in a market with recent losses. RSI values range from 0 to 100 and are plotted on a line below the price chart. The center of the line is 50. When the RSI value moves above 70, the underlying asset is considered overbought. Conversely, the asset is considered oversold when the RSI reads below 30. Traders also use RSI to identify areas of support and resistance, detect anomalies for possible reversals and confirm the signals from other indicators.
Stochastic oscillators were created by George Lane. Lane believed that prices tend to close near their highs in up markets and near their lows in down markets. Like the RSI, stochastic values are plotted in a range between 0 and 100. Pre-bought conditions exist when the oscillator is above 80 and the asset is considered oversold when values are below 20. Stochastics actually uses two lines (known as K and D lines) and a crossover analysis can be performed based on the relationship between each of them.
Generally speaking, RSI is more useful in trending markets and stochastics are more useful in sideways or choppy markets. The RSI was designed to measure the speed of price movements, while the stochastic oscillator formula works best in consistent trading ranges.
What is most used by analysts?
More analysts use the RSI over the stochastic oscillator, but both are well-known and reputable technical indicators.
What is the formula for RSI?
The Relative Strength Index (RSI) is calculated using a two-part calculation starting with the following formula:
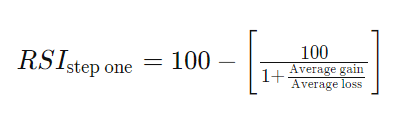
The average gain or loss used in the calculation is the average percentage gain or loss over a look-back period. The formula uses a positive value for the average loss.
The standard is to use 14 periods to calculate the initial RSI value. For example, imagine that the market closed higher seven of the last 14 days with an average gain of 1%. The remaining seven days all closed lower with an average loss of -0.8%. The calculation for the first part of the RSI would look like the following extended calculation: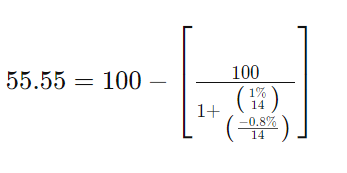
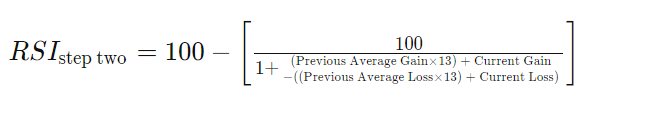
When there are 14 periods available, the second part of the RSI formula can be calculated. The second step of the calculation evens out the results.
 Using the formulas above, the RSI can be calculated, where the RSI line can then be plotted below an asset’s price chart.
The RSI will increase as the number and size of positive closes increase, and it will decrease as the number and size of losses increase. The second part of the calculation releases the result, so the RSI only comes close to 100 or 0 in a strongly trending market.
What is the formula for Stochastics?
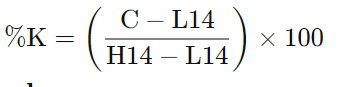
The formula for the stochastic oscillator is:
 There:
C = the last closing price
L14 = The lowest price traded of the 14 previous trading sessions
H14 = The highest price traded in the same 14-day period.
% K = The current value of the stochastic indicator
In particular, %K is sometimes referred to as the fast stochastic indicator. The “slow” stochastic indicator is taken as %D = 3-period moving average of %K.
The general theory underlying this indicator is that in a market that is trending upwards, prices will close near the high, and in a market that is trending downwards, prices will close near the low. Transaction signals are created when %K passes through a three-period moving average, called %D.
The difference between the slow and fast stochastic oscillator is the slow %K contains a %K slowing period of 3 which controls the internal smoothing of the %K. Setting the smoothing period to 1 is equivalent to scheduling the fast stochastic oscillator.
About the Viking
With Viking’s signals, you have a good chance of finding the winners and selling in time. There are many securities. With Viking’s autopilots or tables, you can sort out the most interesting ETFs, stocks, options, warrants, funds, and so on.
Click here to see what Vikingen offers: Detailed comparison – Stock market program for those who want to get even richer (vikingen.se)