Learn more about technical analysis, the Coppoch model
The Coppoch model signals when the sum of mean differences turns up or down. Very good results are obtained when testing backwards and saving the best settings. The problem is that the historical settings in this model are not stable. They are good historically, but my experience tells me that those settings need to be adjusted over time.
As it is a model based on averages, it is a slow model and often gives a signal too late, but still decent. The advantage of averages is that they keep the number of transactions down and give people time to act.
Below is an example with Hennes & Mauritz that has returned 5500%, i.e. 55 times the money if you traded according to the model and monitored with weekly charts. Each bar is how the course has progressed over a week. Red indicates sell and green with K, indicates buy.
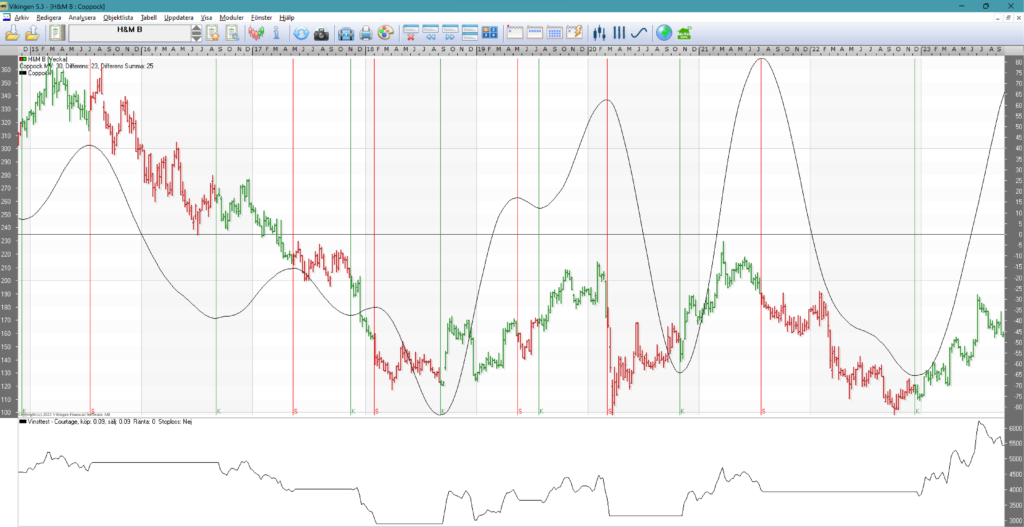
Picture Coppoch H&M B
You can see in the picture that the model sometimes sells a little late, but still reasonably well.
When the price is stationary, the model changes direction frequently and there are too many signals. See below for a daily chart with Handelsbanken.
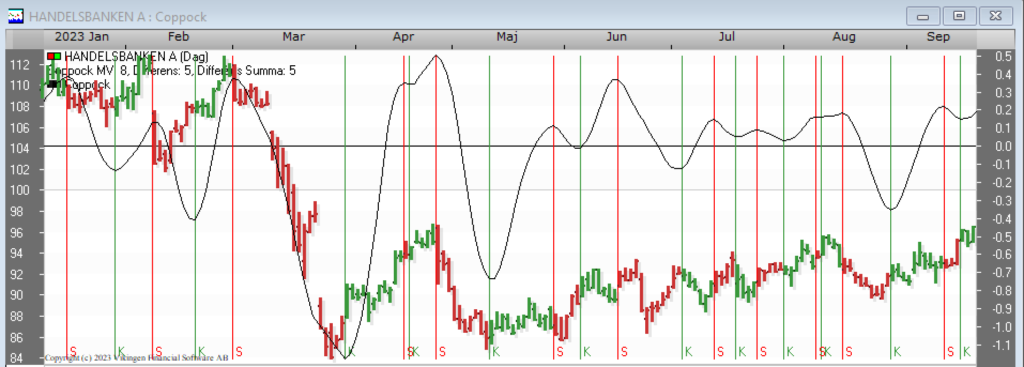
Picture Coppoch Handelsbanken
In times when prices are trending upwards and things are calm, the model works well. Then it is good to combine with other models that are faster like stochastics, volatility signal, multi-model, Peters specialists.
In general, the model seems to perform best with weekly data.
The Coppoch model in detail
The Coppoch model shows the acceleration and deceleration of price developments. It also gives an indication of changes in the long-term trend.
The model is calculated as follows:
1) Calculate the moving average, A, with the length “MV length”.
2) Calculate the relative differences between mean, A, with the same mean, B, time-shifted “MV Difference” periods backwards in time.
3) Calculate the weighted sum over the “MV Difference Sum” pieces of these differences. Give the ‘oldest’ difference a weight of one and then gradually increase the weight by one.
Buy signals are given when the Coppock curve is rising.
Sell signals are given when the Coppock curve is falling.
Settings:
Mv length = the length of the price average.
MV Difference = number of periods on which the difference between the price averages is calculated.
MV Difference Total = number of differences summed up.
Good settings of the Coppoch model
With Vikingen Trading or Vikingen Maxi, it is possible to do back testing and test many combinations. The values below are the result of a test with 2.5 million combinations run on the 170 most traded shares in the Nordic region. Each share was saved with its own best optimized settings. On average, these settings were the best:
| Average value | Mean difference | Mean difference sum | |
| Day | 21 | 15 | 13 |
| Week | 21 | 15 | 11 |
| Month | 17 | 11 | 5 |
Disclaimer
Keep in mind that saving in securities always involves a risk. The value of your investment can go down as well as up and you may not get back the full amount you invested. Nor is the historical performance of a security a guarantee of future performance. Investing in securities always involves the risk of losing your money.
About the Viking
With Viking’s signals, you have a good chance of finding the winners and selling in time. With Viking’s autopilots, models, price data, tables and stock prices, you can sort out the most interesting ETFs, stocks, options, warrants, funds, certificates, mutual funds, etc. Read more here:
Home – Stock market program for those who want to become even richer (vikingen.se).
To access Certificates in Vikingen, first subscribe to Vikingen Mini/Exchange/Trading and add Certificates. For example Vikingen Börs with autopilot and Certificates, 390 + 79 kr per month. Or add shares from other exchanges, €790 per exchange per year (Denmark, Norway, Finland, Nasdaq, NYSE).
The Viking Maxi subscription includes all databases, including, for example, options. The Viking Maxi costs SEK 990/month. A small cost compared to what many people invest in options.
Peter Östevik, Vikingen Financial Software AB