Interest cost traps in forex and oil trading

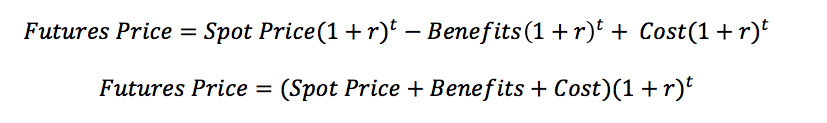
We show you how to protect yourself from interest cost traps in forex and oil trading. The costs of owning commodities and currencies through CFDs are based on the derived holding costs built into the underlying futures contracts, from which the prices are derived. A cash price is a product without a fixed expiry or settlement date. For futures contracts traded on the major exchanges, it is common to see the price exceed the spot price, the price at which trades are settled today. The formula below describes this procedure. The price of these futures is based on holding the futures contract until maturity, unlike a CFD which is generally only owned for the day, or at most a few days.
 The price of CFDs removes the derived holding cost (as described above) to create a continuous ‘cash price’. The derived daily holding cost is then applied as the holding cost, which can be positive or negative. This allows traders to trade at a continuous price, unlike commodity futures which are not subject to an expiry date.
Using underlying futures price data as a base, the broker’s automated pricing engine calculates theoretical cash prices for each commodity and currency by adding or subtracting (where applicable) the implied holding cost. Using these theoretical cash prices as a basis, the broker’s automatic pricing engine derives price depth ladders containing up to ten depth levels for each cash item and cash. Each level shows transparent volume obtainable at a distinct price, with volume and applicable spread increasing as you move further down the ladder.
The implied holding cost, plus or minus a small administrative cost, is then applied daily to positions held at the same time. 17 (New York time) as a daily holding cost amount. The price of the cash product is based on the nearest most liquid futures contract, or primary contract, so over time when the underlying futures contract expires, the primary contract will change, which generally coincides with the rolling dates of our futures instruments.
Before any change to the primary contract, the implied holding cost level is calculated and determined and measures the difference between the mid-price of the next main contract and the mid-price of our current cash price. Each time the broker updates its master contract, the holding cost ratio is recalculated to reflect this change.
An illustrative example
The front-month contract for Brent Crude Oil was moved from the June contract to the July contract on April 28 at noon. 21.30 (UK time).
1st Brent Crude Oil average price 47.48 – Brent Crude Oil Cash average price 47.79 = -0.31
2. Expiry of the July contract 30 May – 28 April = 33 days
3. -0,31/33 x 365 = -3,42879
4. -3,42879 / 47,79 = -7,175%
5. buy or long position = (-7.175% + 2.5%) x -1 = 4.6747%.
6. sell or short position = (-7.175% – 2.5%) x -1 = 9.6747%.
Financing costs
Find out how your broker calculates its funding costs so you can better understand the funding fee or funding credit when trading CFDs.
CFDs on FX, metals (except copper) and indices
If you have an open position in your account at the end of each trading day (17:00 ET), the position is considered to be held overnight and is subject to either a funding charge or credit to reflect the cost of funding your position (relative to the margin used).
The financing cost is calculated per position and can be a fee or a credit to your account, depending on whether you hold a long position (buy) or a short position (sell), and after also taking into account the impact of the broker’s administration fee.
FX and metals (except copper): daily funding fee or credit = position size x applicable funding rate / 365
Index: daily funding fee or credit = position value * x applicable funding rate / 365
* where position value = position size x price at the end of the trading day (17:00 ET)
Funding rates (or ‘swap rates’ for FX products) vary by instrument and can change daily. These are stated as an annual interest rate. Each instrument has two quoted interest rates: one for a buy/long position and the other for a sell/short position.
A negative funding rate results in a debit to your account, and a positive funding rate results in a credit to your account.
The daily funding fee or credit will be charged/transferred from/to your account every day and will be visible in your transaction history available through your account portal.
How are financing rates calculated
The table below shows how brokers calculate financing rates for CFDs, metals and indices.
| Funding rates (long / buy positions) | Financing rates (short / sell positions) | |
| Currencies and metals (excluding copper) | The rates are based on a mix of the next exchange rates of the underlying liquidity providers, adjusted by the instrument-specific administration fee and annualized. | The rates are based on a mix of the next exchange rates of the underlying liquidity providers, adjusted by the instrument-specific administration fee and annualized.
|
| Index | Index rates are administration fee of 2.5% plus relevant * interbank funding rate, annual. This is represented by a negative interest rate and thus a charge.
* rate used in the country whose currency is the instrument’s offer currency using the table below. |
When the relevant *interbank funding rate is lower than our administration fee of 2.5%, the interest rate used will be the difference between the two, on an annual basis. This is represented by a negative interest rate and therefore a fee.
* rate used in the country whose currency is the instrument’s offer currency using the table below.
|
Your broker’s website usually lists their financing costs. You can select the instrument you want to trade and it calculates both the annual funding rate (including the administration fee) and the expected daily funding cost based on prevailing interest rates. In addition, you will also see historical funding levels.
| Index | Interbank funding ratio |
| Australia 200 | Australia Bank Bill – 3 months |
| China A50 | USD LIBOR – 1 month |
| Germany 30 | EURIBOR – 3 months |
| Europe 50 | EURIBOR – 3 months |
| France 40 | EURIBOR – 1 month |
| Hong Kong 33 | HKD HIBOR – 1 month |
| India 50 | USD LIBOR – 1 month |
| Japan 225 | USD LIBOR – 3 months |
| US Nas 100 | USD LIBOR – 3 months |
| Netherlands 25 | EURIBOR – 1 month |
| Singapore 30 | SGD SIBOR – 1 month |
| US SPX 500 | USD LIBOR – 3 months |
| Taiwan Index | USD LIBOR – 1 month |
| UK 100 | GBP LIBOR – 3 months |
| US Russell 2000 | USD LIBOR – 3 months |
| US Wall St 30 | USD LIBOR – 3 months |
Administrator’s fee table
| TRY (all pairs) | 4,00% |
| CZK, HUF, SAR, THB, ZAR | 2,00% |
| Other pairs | 1,00% |
Financing costs affected by holidays and weekends
Currencies and metals (except copper) usually trade on a T+2 basis, which effectively means that weekend funding is usually applied two days earlier on Wednesdays (tripling the regular daily rate), although this timeline is similarly affected by holidays. This means that someone who trades, for example, oil on a Wednesday and chooses to keep the position through Thursday will be charged triple the cost of the weekend, even if the position is closed on Thursday. The explanation is that the formal closure takes place only after the weekend.
Indexes typically affect weekend funding on a Friday (tripling the usual daily rate), although this timeline is also similarly affected by holidays. Consequently, the actual funding rate on a given day may reflect more than one day’s costs.
No financing fees or credits are applied to customers’ accounts during the weekend.
CFDs on commodities (plus copper) and bonds
The prices of commodities (including copper) and bond CFDs are based on underlying futures contracts. When an underlying futures contract is close to expiry, the base rate is calculated, which represents the price difference between the expiring futures contract and the next futures contract. From then on, the CFD price is calculated as the present value of the price of the next futures contract with the base rate for the present value calculation. The present value is calculated continuously, second by second.
When the base rate is positive, the CFD price tends to move upwards towards the contract price. When the base rate is negative, the CFD price tends to move downwards towards the contract price.
Financing costs on commodities (including copper) and bonds CFDs are therefore continuously calculated second by second.
For the duration of trading, the resulting funding fee/credit is debited/credited at the end of each day (17:00 ET), including weekends and holidays, and when trading is closed.
Financing costs or credits are calculated as follows:
Financing cost or credit = position size x applicable financing rate x [duration of the trade (in days) / 365 days] x conversion rate to spot currency.
About the Viking
With Viking’s signals, you have a good chance of finding the winners and selling in time. There are many securities. With Viking’s autopilots or tables, you can sort out the most interesting ETFs, stocks, options, warrants, funds, and so on.
Click here to see what Vikingen offers: Detailed comparison – Stock market program for those who want to get even richer (vikingen.se)