How the Benner cycle predicts 100+ years of market movement

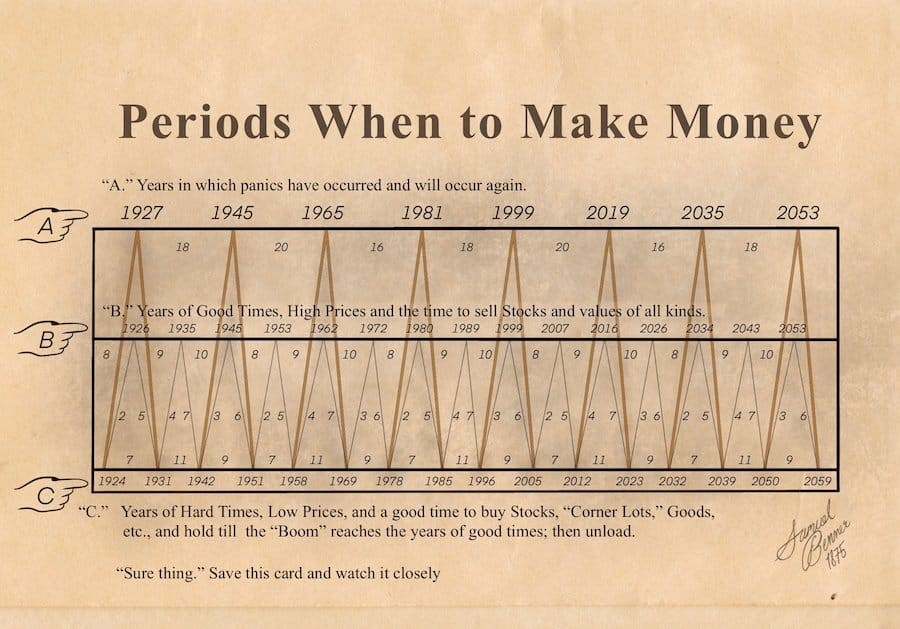
Samuel Benner was a 19th century farmer who wanted to understand how market cycles worked. In 1875, he published a book dedicated to the Benner cycle that predicted business and commodity prices. He identified years of panic, years of good times and years of hard times.
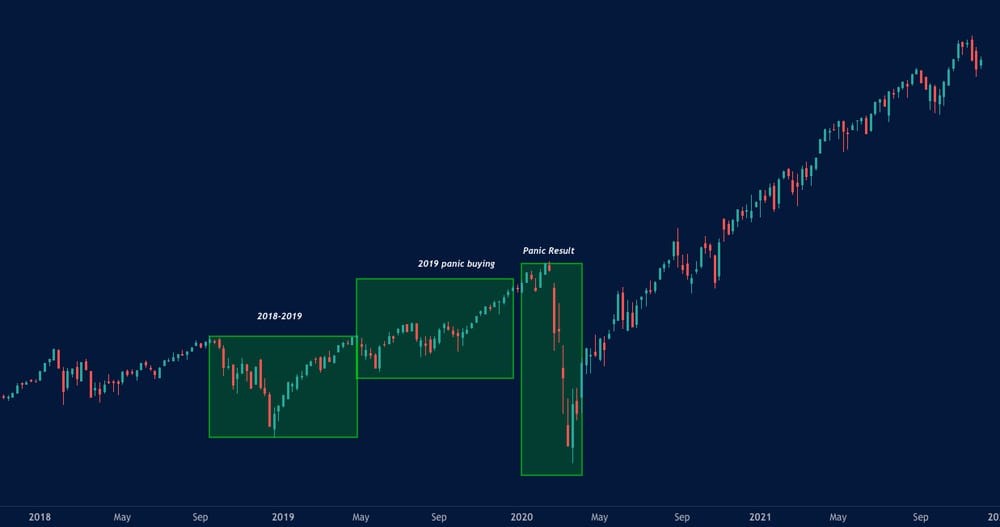
Panic years: These are years when the market panicked, either buying or selling a stock irrationally until its price skyrocketed or plummeted beyond anyone’s wildest expectations.
Good times: Years Benner identified as times of high prices and the best time to sell stocks, values and assets of all kinds.
Hard times: During these years, Benner recommends buying stocks, commodities and assets and holding them until the “boom” years of good times, then unloading.
 100+ years of ‘Sure Thing’
At the bottom of his card, Benner wrote ‘Sure Thing’. and for 100 years he has been close to perfect. As a prosperous Ohio farmer, the market panic of 1873 was a blow to Samual Benner, and it wiped him out. In trying to understand why this happened, Benner discovered the concept of market cycles.
As a farmer, Samuel knew that seasonal cycles affect crops which then affect supply and demand, which affects price. Benner looked deeper into these cycles and found an eleven-year cycle in corn and pig prices with peaks every 5/6 years. This matches the 11-year solar cycle. Benner considered that this solar cycle affects the harvest, which affects revenue, supply/demand and price.
The Benner cycle also uses a 27-year cycle in pig iron prices with low prices every 11, 9, 7 years and peaks coming in at 8, 9, 10 years.
Studying market history will help you learn how these cycles affect the price and how they still affect the price today. Now the year is 2024, and according to the Benner cycle, we are just coming out of a panic cycle.
 There is no other mention on the Benner Cycle chart until 2023, so we can continue to grind the market higher until it breaks, resulting in another market crash and “Years of Hard Times” in the market.
There is no exact science to market predictions, especially coming from a pig farmer 100 years ago, but the world is cyclical and it pays to pay attention.
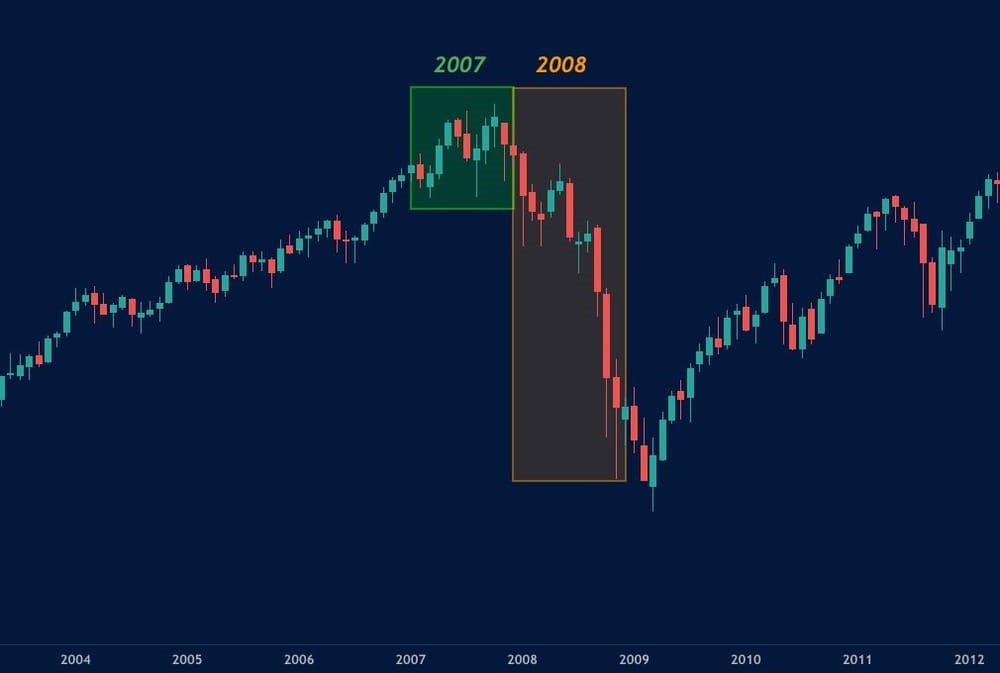
The Benner cycle says that 2007 was a year of high prices and a time to sell stocks. If you see the S&P chart below, this would have prepared you well for the coming crash of 2008.
 When using the Benner cycle, combine it with other indicators and reasons for switching. This cycle study is a good long-term warning sign for potential reversals and panic, but you still have to make it work within your trading plan.
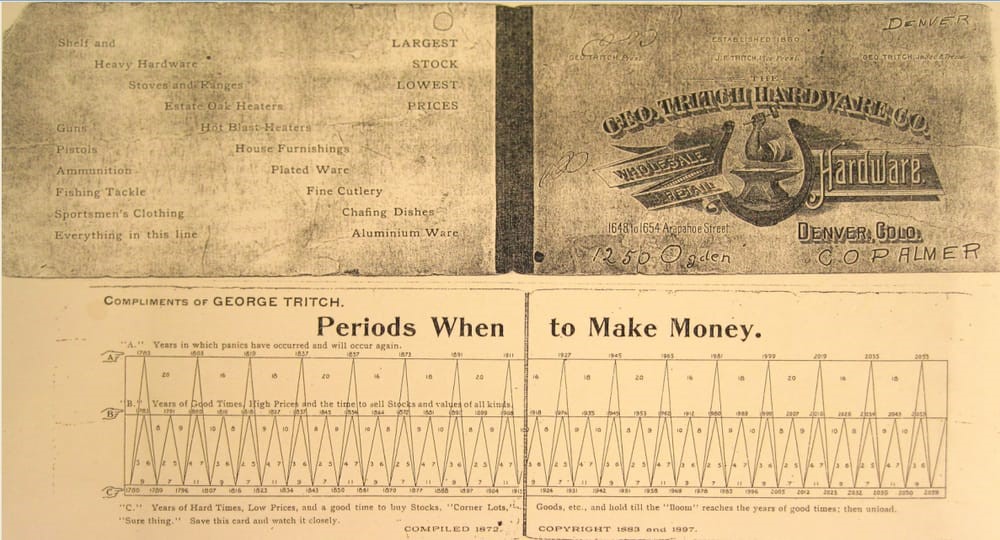
 Here is the original Benner Cycle diagram.
 About the Viking
With Viking’s signals, you have a good chance of finding the winners and selling in time. There are many securities. With Viking’s autopilots or tables, you can sort out the most interesting ETFs, stocks, options, warrants, funds, and so on. Vikingen is one of Sweden’s oldest equity research programs.
Click here to see what Vikingen offers: Detailed comparison – Stock market program for those who want to get even richer (vikingen.se)