Sector Rotation on the Stock Market, Post 2, Week 47

Sector rotation, momentum, and technical signals—three keys to better understanding stock market behavior!
In this blog post, we continue our series on sector rotation. The first post was published in Week 45. You can read it here.
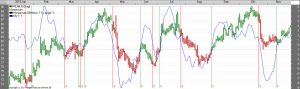
Why might a good stock fall while another rises sharply?
How is it that the stock of a well-managed and profitable company can fall on the stock market, while the stock of a significantly less profitable company rises sharply?
This is because the stock market is not solely driven by companies’ financial results. It is also influenced by investor expectations, capital flows, interest rates, the economic cycle, and, not least, market psychology.
To better understand these movements, let’s take a closer look at three key concepts: sector rotation, momentum, and technical buy and sell signals.
They are related, but they mean different things.

1. Sector Rotation – Where is the Capital Headed?
In the first blog post in this series, we described how capital flows between different sectors in the stock market.
When investors anticipate rising economic growth, interest may increase in sectors such as industrials, banks, tech companies, or cyclical consumer companies.
If, on the other hand, the economy shows signs of weakening, investors may begin to turn to more defensive sectors, such as healthcare and consumer staples.
This is called sector rotation.
The important thing to understand is that a company’s stock doesn’t have to be performing poorly for its share price to fall. If major investors reduce their exposure to a particular sector, stock prices can be pushed down, even if the companies’ businesses continue to perform well.
Sector rotation can therefore help us understand why certain segments of the stock market are performing better than others.

2. Momentum – the force behind an ongoing price movement
Momentum is a concept from physics that describes momentum. In the stock market, it is used to describe the strength of a price movement and the tendency for a previous trend to continue over a certain period of time. You can think of momentum as the force of a large, impressive wave.
A stock that has risen sharply in recent months may continue to perform strongly. Similarly, a stock that is in a clear downward trend may continue to fall.
Why? One explanation is investor behavior.
When a stock begins to rise, more investors may take notice and jump on board. Increased buying interest can contribute to further price gains, which in turn attracts more buyers. The momentum builds.
There are several ways to measure momentum, such as by analyzing a stock’s price performance over three, six, or twelve months.
Momentum can be either positive or negative, and it can change rapidly; it therefore describes how strong a price movement has been—not whether the stock is cheap or expensive.

3. Technical Buy and Sell Signals – When will Market Behavior Change?
Technical analysis involves studying historical price movements, trading volumes, and other market data to identify trends, patterns, and potential changes in market direction.
Various analysis models and indicators are used here. Vikingen offers over 50 different models.
Vikingen’s BEST Model, which is based on several well-known models and has been developed and refined by Peter Östevik over the course of 30 years. It was named BEST because it turned out to be the best model! Read more about The BEST Model here.
Moving averages can help us identify a stock’s overall trend.
The RSI (Relative Strength Index) can show how strong recent uptrends or downtrends have been in relation to one another.
MACD (Moving Average Convergence Divergence) can be used to analyze changes in trend and momentum.
Trading volume can provide insight into the activity driving a price movement.
A technical buy signal occurs when certain predetermined criteria in an analytical model are met. A sell signal occurs when other criteria are met.
It is important to remember that these signals are not guarantees. They are based on historical data and probability assessments, and even strong signals can turn out to be incorrect. This is where our human judgment comes into play. We use models and technical analysis, and together with our own judgment, this helps us make wise, well-informed decisions about our investments.
Technical signals, therefore, aim to help us identify when the conditions for an investment may have changed.

4. How are these three concepts related?
Imagine the following situation:
A large group of investors is beginning to shift capital from the technology sector to the industrial sector.
This is sector rotation.
As more and more investors buy industrial stocks, the share prices of many of these companies begin to rise. After a while, a clear upward trend (a strong upward surge) may develop.
This could create positive momentum.
When price movements meet certain criteria in a technical analysis model, the model can generate buy signals.
So we have three different perspectives on the same market trend:
Sector rotation describes how capital and investor interest shift between sectors.
Momentum describes the strength and persistence of price movements.
Technical signals indicate when specific, predetermined market conditions are met.
However, the pattern is not always the same. Individual stocks may begin to show strength before a broad sector rotation becomes apparent, and technical signals can appear both early and late in a trend.
Summary
To understand stock market movements, we need to look at more than just companies’ earnings.
Sector rotation helps us understand which parts of the market—which industries and sectors—are currently performing well.
Momentum shows how strong the current price movements are. We want strong, powerful price swings—and definitely upward ones!
Technical buy and sell signals help us identify changes according to specific analysis rules based on various models that reflect reality.
Together, these perspectives can give us a broader understanding of stock market behavior and help us make more informed decisions, rather than letting momentary emotions guide our investments.
Please note that historical price patterns and technical signals do not guarantee future returns. All investments in stocks and other instruments involve risk, and the value of your investment may decline.

Have you seen Vikingen’s new service called Vikingstocktips.com?
Vikingstocktips is a brand-new stock-picking service that combines Vikingen’s BEST model, 40 years of experience and development, with modern technology! When you sign up for Vikingstocktips, you’ll get the first two weeks completely free!
Would you like to learn more about Vikingstocktips.com and who the program is designed for? Join the webinar hosted by Peter Östevik on November 22 and November 29 from 7–7:30 p.m. CET. You’ll learn everything about the service and have the chance to ask Peter questions. You can join via Google Meet! 👉🏻 The same link applies to both sessions ☺️ The webinar is free and open to everyone!

Don’t miss Black Week at Vikingen and Vikingstocktips November 23–29, 2026!
If you’re thinking about buying Vikingen or Vikingstocktips—or both—be sure to take advantage of the offer next week (Week 48). All week long, you’ll get 40% off everything in Vikingen’s online store when you use the code BLK2026.
For Vikingen, the 40% discount applies to all basic programs— Vikingen Mini, Börs, Trading, and Vikingen Maxi —as well as all add-ons.
For Vikingstocktips.com, you get 40% off 6- or 12-month subscriptions! The code is the same: BLK2026
Don’t miss out—it doesn’t get any better than this! The offer cannot be combined with other Vikingen offers!

The Benefits of Having Vikingen and Vikingstocktips!
Peter Östevik, who has played a crucial role in developing Vikingen and also created Vikingstocktips.com, says that “Everyone who invests in the stock market should use Vikingen’s program”! Why is that?
Well, first and foremost, to avoid losing money! Both the Viking program and Vikingstocktips provide clear sell signals based on 40 years of experience. We all know that if a stock drops 50%, it needs to rise 100% for us to recoup our losses!
Of course, it’s also exciting and interesting to use Vikingen and Vikingstocktips.com to find the most promising stocks and other investment instruments.
You can get the expert help you need to make well-informed decisions by using Vikingen Börs, Vikingen Trading, or Vikingen Maxi in combination with Vikingstocktips.com.
Vikingen is built on 40 years of experience and refinement. And Vikingstocktips.com is an automated version of Vikingen Trading, designed primarily for those who don’t want to delve into technical analysis. The program does the analysis for you!
And to discuss and learn from like-minded people is Börssnack via Aktieutbildning.nu one of the best forums on the market. In Denmark, you can participate in the Vikingen Network! Welcome!
Vikingen Financial Software reminds you that past performance is not always an indication of future returns and that all trading is at your own risk.
Best regards