Gold in this week’s analysis!

Aksjeanalyser.com looks at the Gold Price!
What does the technical picture for the Gold Price signal say about future developments?

Technical Analysis of the Gold Price
The gold price is in a long-term rising trend, but there have been several technical signals in recent months indicating that the gold price may have peaked for the time being.
A medium-term declining trend has been established since the peak at the end of January 2026, with further declines now being signaled for the gold price within this declining trend.
![]()
The gold price is encountering significant technical resistance around the USD 5,000 level, and there is also technical resistance now at the 50-day moving average (around USD 4,850).
Further declines are signaled in the short term for the gold price, and down for a new test of a now very important technical support level around USD 4,300, where there will be a new test of the support level at the 200-day moving average.
A break below the USD 4,300 level and below the 200-day moving average will trigger a new and more powerful technical sell signal for the gold price.
Then, a further decline towards the USD 3,500 level will be signaled for the gold price.
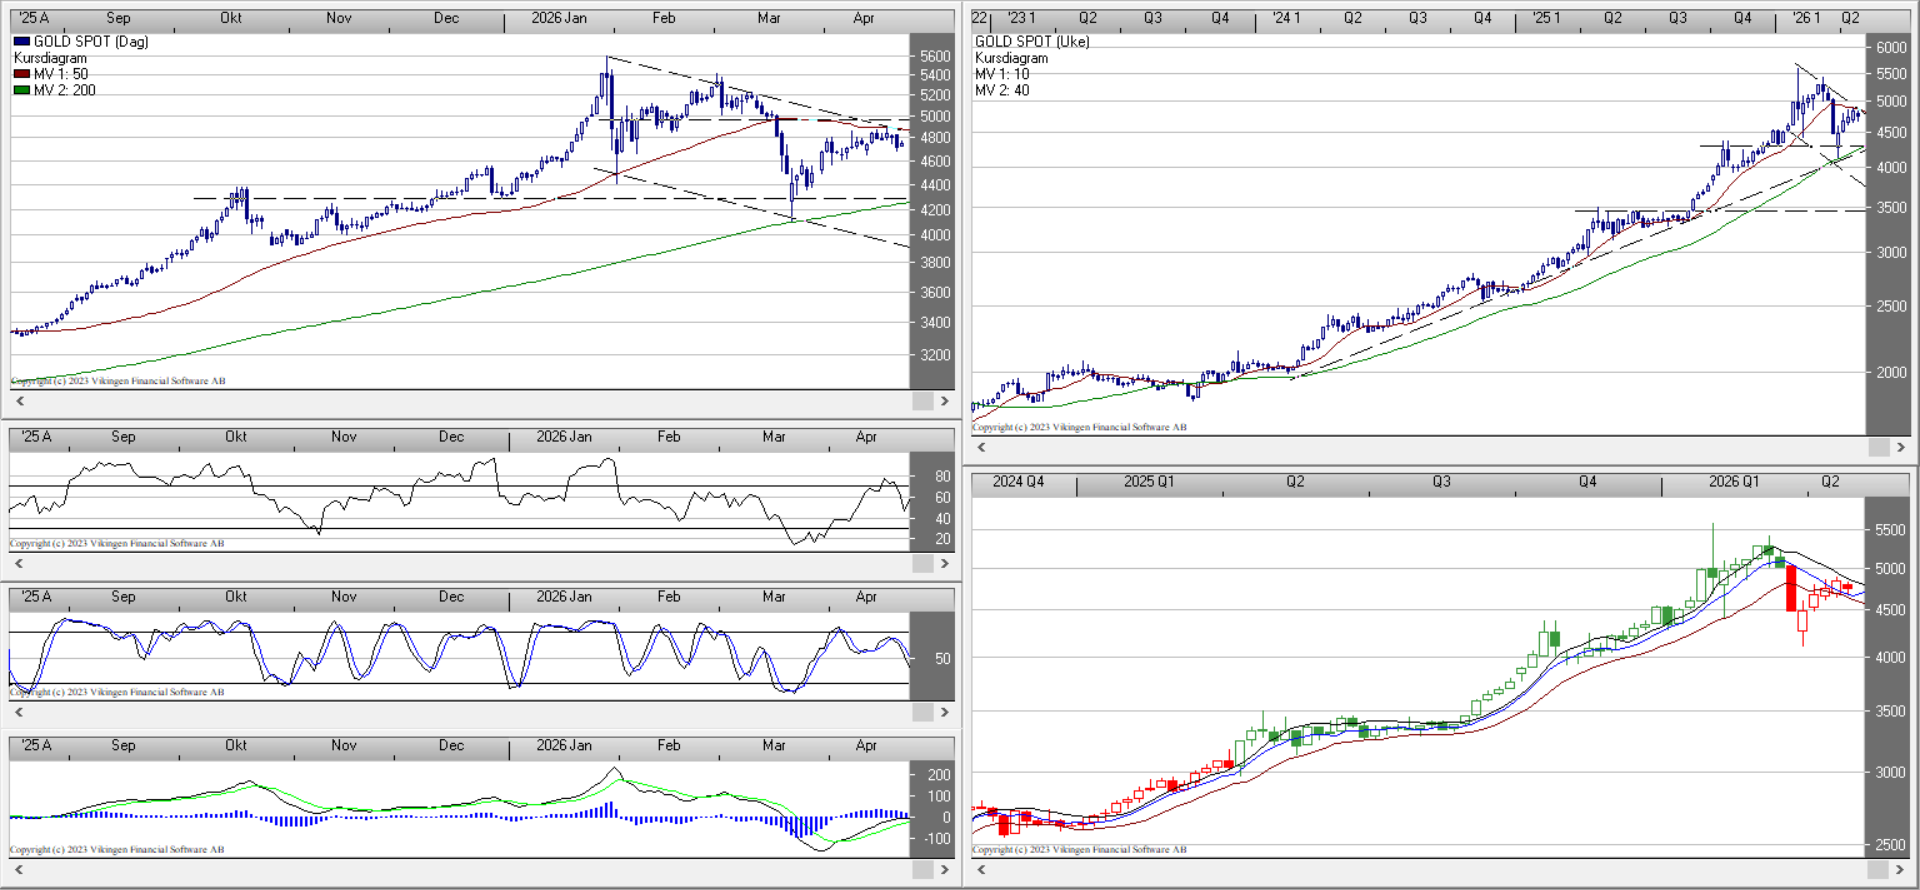 To change the currently negative technical picture for the gold price, it must manage to break above the 50-day moving average and above the important technical resistance level around USD 5,000.
The BEST model in Vikingen is also in a sell signal for the gold price. This popular and effective technical analysis model was developed by Peter Östevik. He finalized the BEST model around 2019, and after 30 years of experience in technical analysis and Vikingen Financial Software.
Based on this overall technical picture that the gold price is now showing, the Aksjeanalyser.com assesses that the gold price is likely to decline further, and initially down for a test of the important technical support level at the 200-day moving average and the level around USD 4,300.
Should the gold price also break down below the USD 4,300 level and below the 200-day moving average, yes, then further declines are expected for the gold price and down towards the USD 3,500 level.

Don’t miss Börssnack and the courses via Aktieutbildning.nu!

Every week you have the opportunity to participate in Börssnack, which Aktieutbildning.nu gives on Wednesdays, via an open webinar at 19.00-20.00!
In Börssnack, you’ll learn how to invest in interesting companies and get answers to questions like:
How do we make better deals on the stock market? Which global stock markets look the best? How should you act in the stock market? Is it time to buy/sell now? Which stocks and funds are interesting? What does Börssnack’s portfolio look like?
It is reviewed and analyzed every Wednesday. How do we use the stock analysis program Vikingen.se?
Aktieutbildning.nu offers several valuable training courses. Now on an updated platform! We welcome you!
Vikingen Financial Software reminds you that past performance does not always indicate future profits and that all trading is at your own risk.
Yours sincerely
Catrin Abrahamsson-Beynon